Oyster Bay Segment Targets
Oyster acreage targets are based on the Habitat Master Plan goal of 471 acres by 2050, where the total goal is divided among the seven bay segments. Two options are provided.
Option 1: Proportional to OHSI
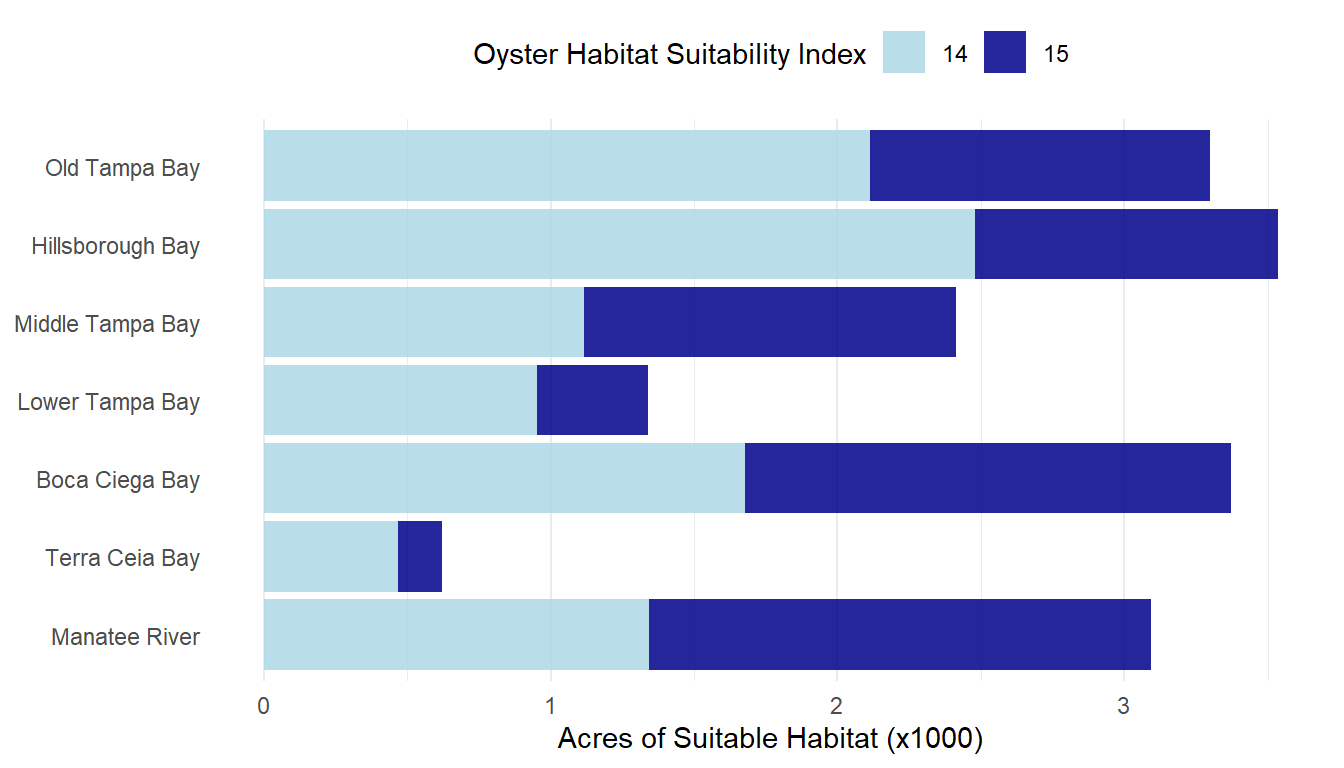
Option 1 defines potential targets for the seven bay segments using the Oyster Habitat Suitability Index (OHSI). OHSI categories 14 and 15 are considered ideal restoration potential for oysters and targets are based on the relative proportion of acres in each bay segment, where the sum is 471 acres. Potential targets are based on proportions of OHSI categories as 14 and 15 or only category 15 (top priority). This option assumes that restoration should be focused on areas with the highest OHSI categories or restoration potential, rather than areas where oysters have been present in the past.
Tabular Summary of Oyster Habitat Suitability Index (OHSI) 14 and 15 Acreage by Bay Segment
Targets can be defined based on the proportional acreages by bay segment, considering OHSI categories 14 and 15 or only category 15.
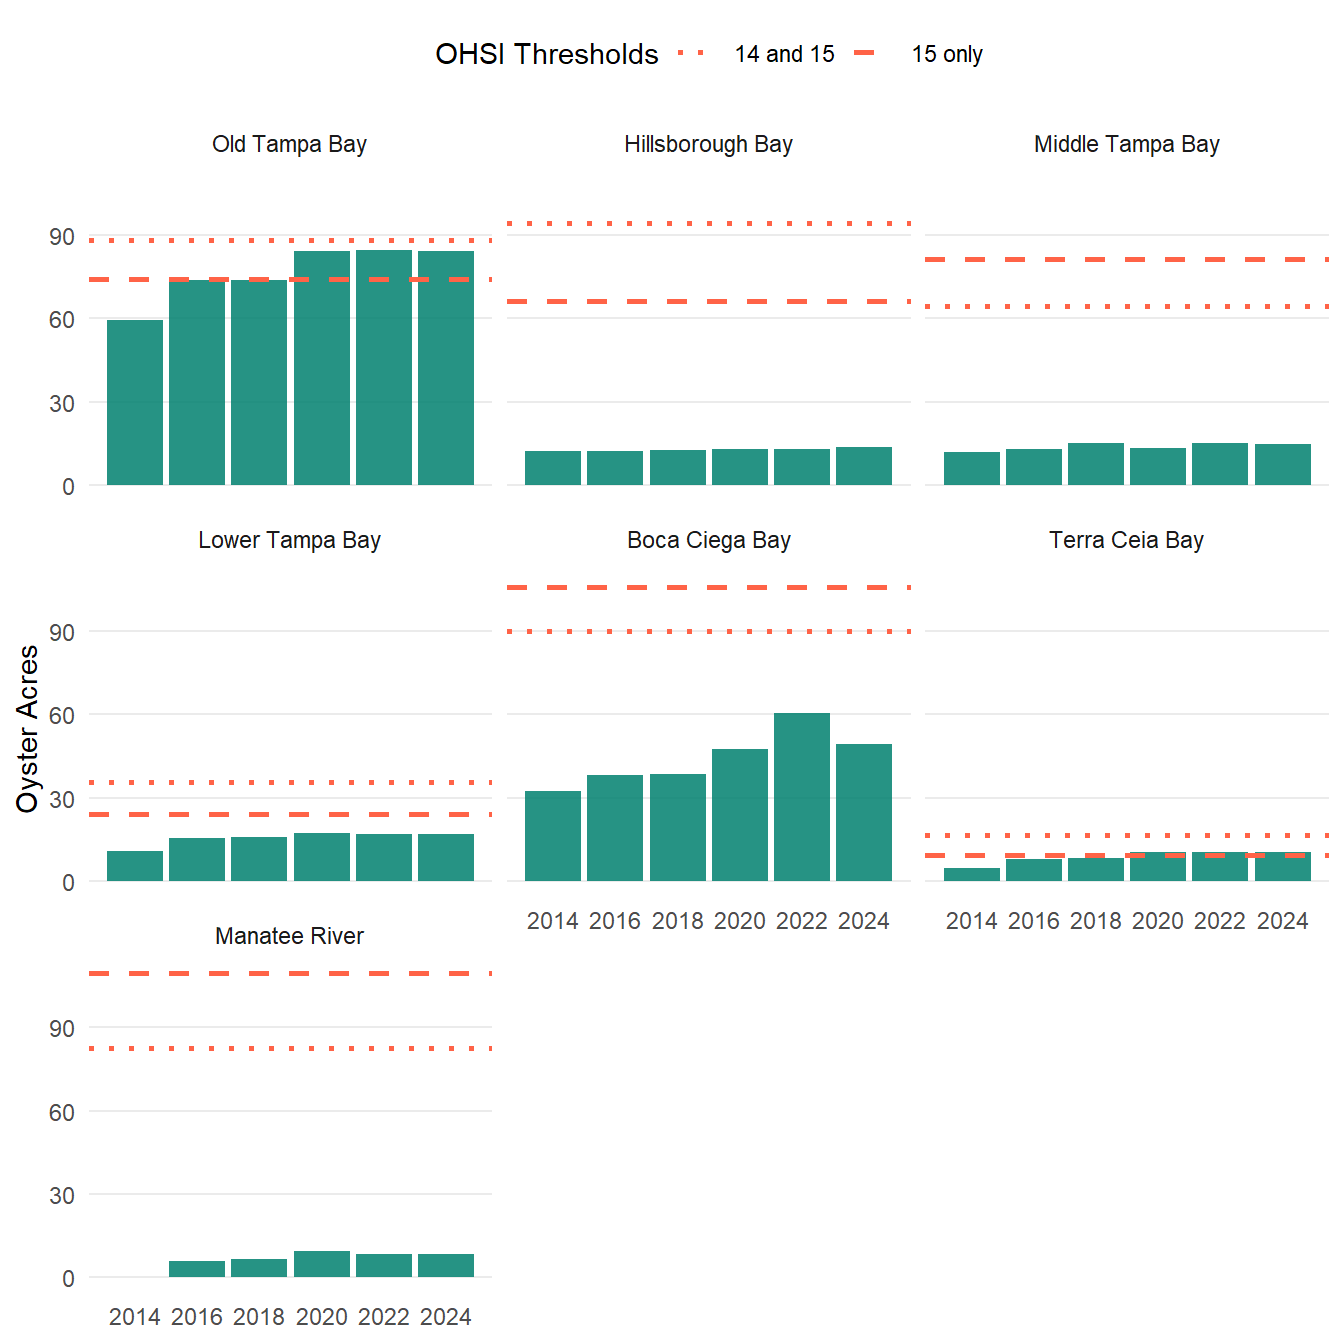
Potential Oyster Targets by Bay Segment based on a 2050 Goal of 471 Acres Set Proportionally by OHSI Categories 14 and 15 or Only Category 15
An assessment of trends in oyster acreage by bay segment relative to the potential targets can help identify restoration priorities.
Lastly, a comparison of current (2024) oyster coverage relative to OHSI categories can also inform restoration priorities. The following provides an assessment of the percentage of oyster coverage currently within high priority OHSI categories relative to coverage that is not. The map below shows current oyster coverage relative to OHSI categories 14 and 15 (note that geometries have been simplified slightly to improve map rendering).
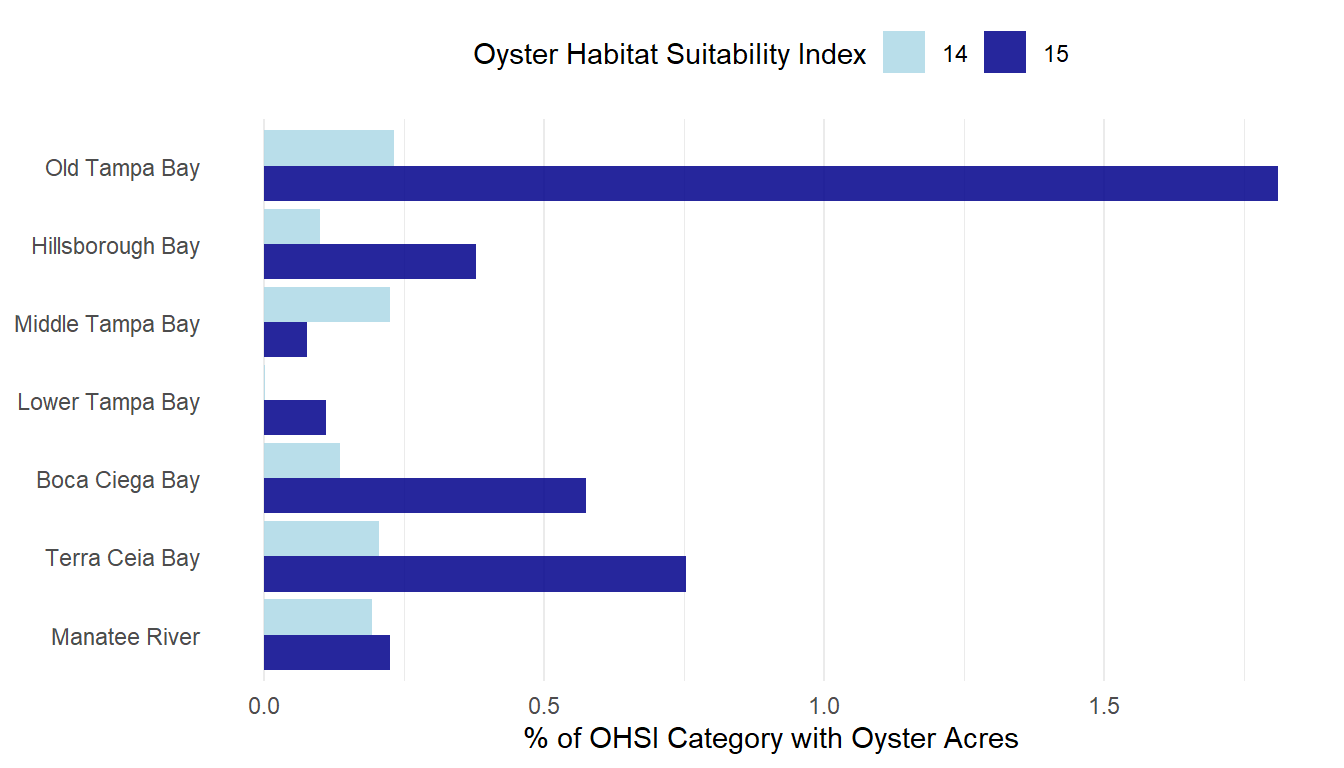
The next two plots provide a graphical summary of current (2024) oyster coverage relative to OHSI categories 14 and 15 and oysters in neither OHSI category. The second plot shows the percentage of the total OHSI categories 14 or 15 that include oysters.
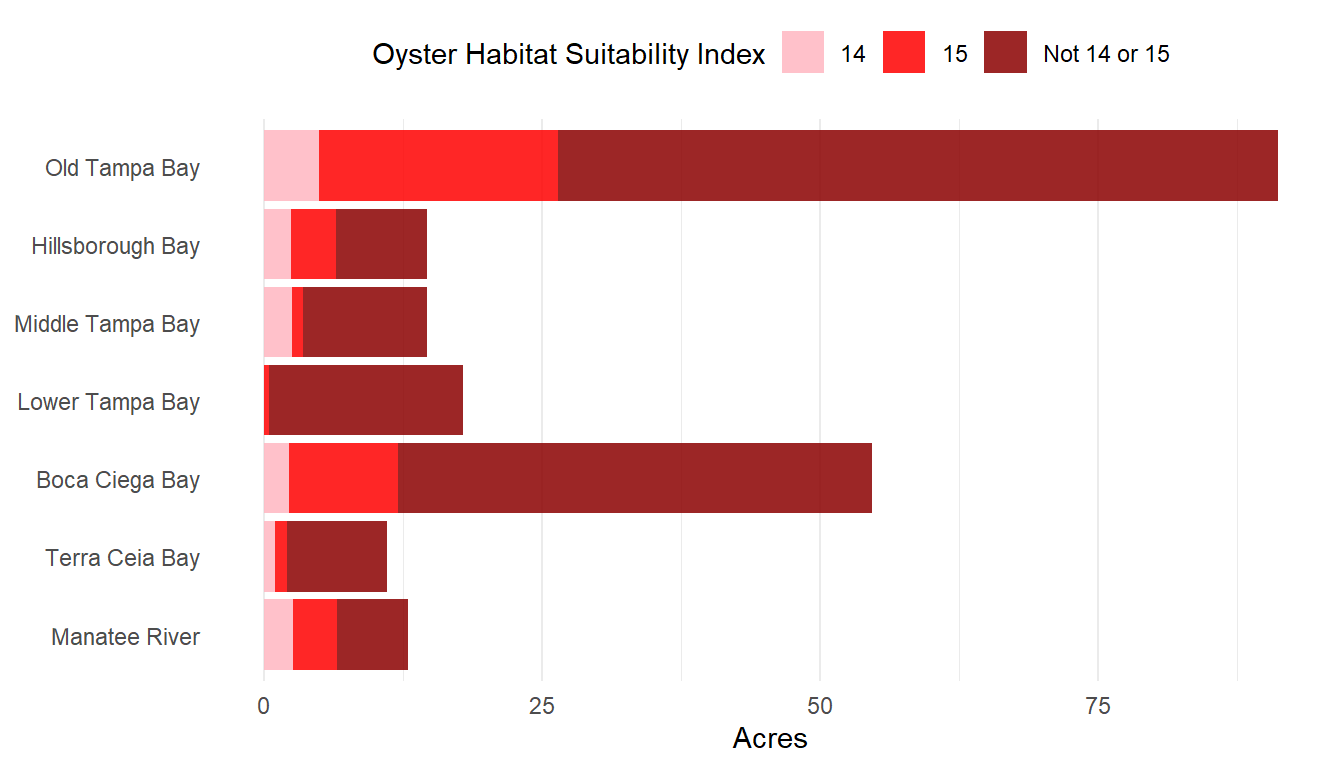
The table below shows a tabular summary of current (2024) oyster coverage by OHSI category 14, 15, and neither.
Oyster Coverage Total by bay segment and OHSI categories 14, 15, or neither
Option 2: Proportional to maximum oyster coverage
The second option estimates targets based on the proportion of maximum oyster coverage by bay segment, where the sum of the proportions is 471 acres. This approach assumes that targets should be based on areas where oysters have been present or what is more easily attainable, rather than the OHSI categories. Maximum oyster coverage was observed in 2022.
Maximum observed oyster coverage (2022) and proportional target based on 471 acres
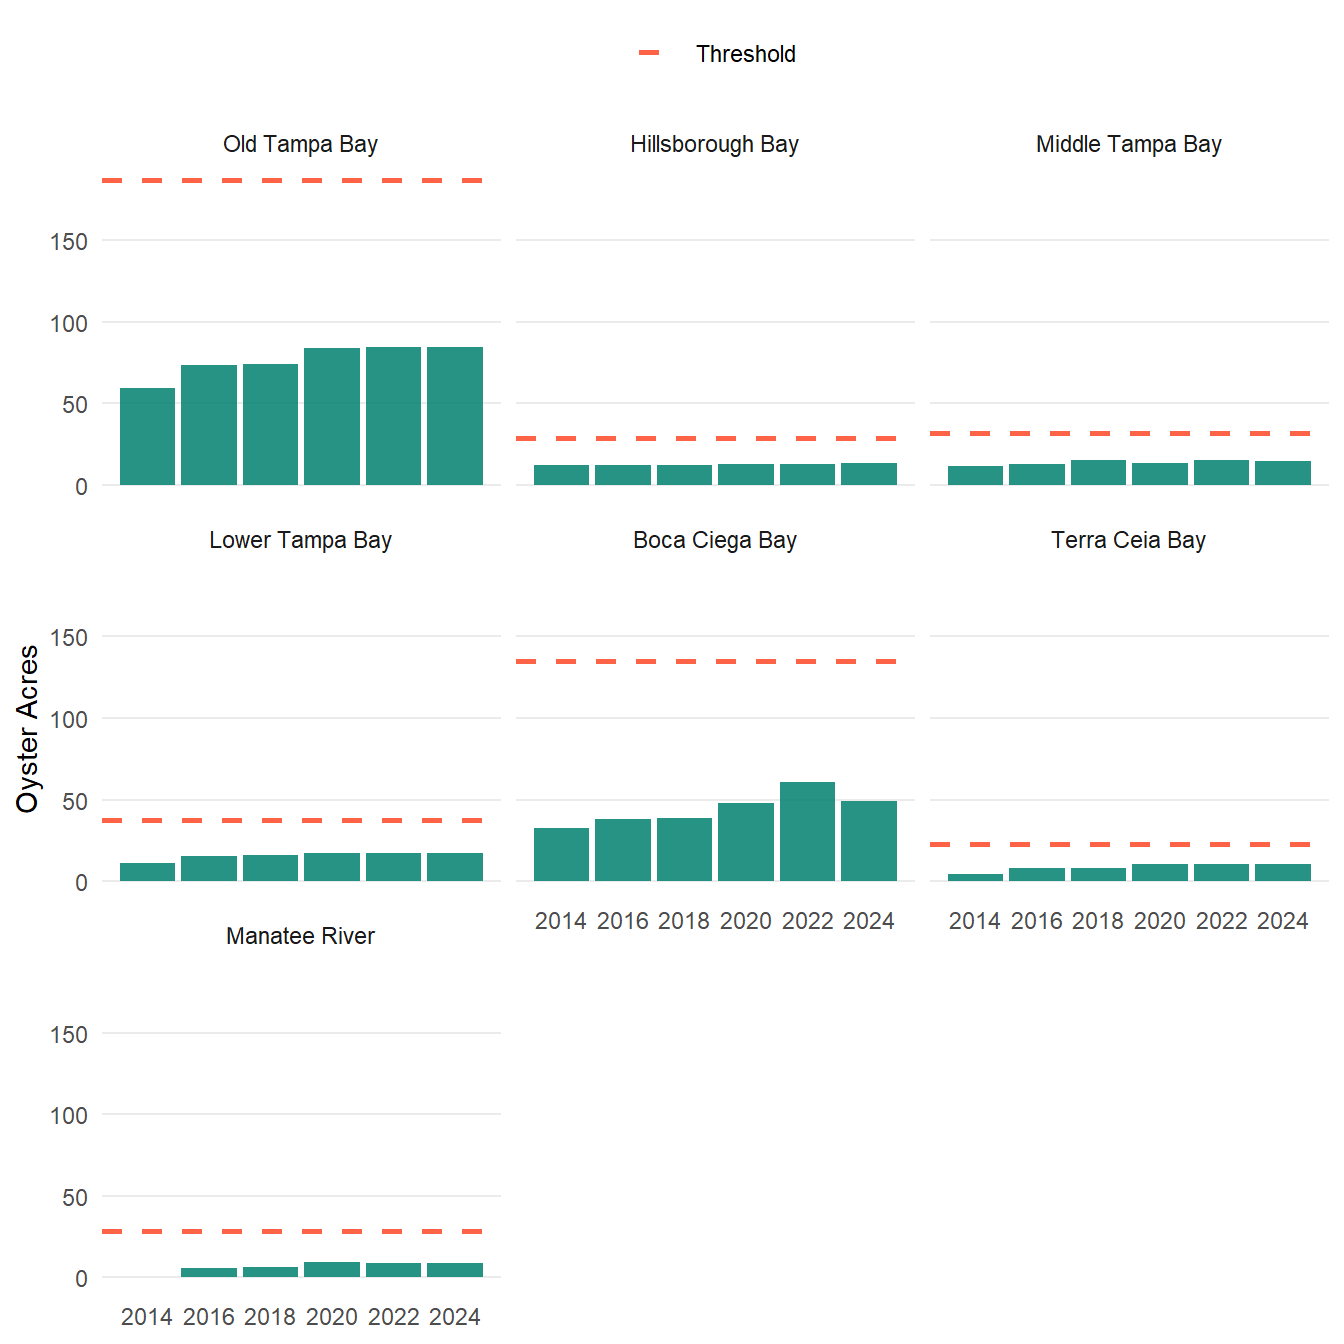
Finally, the potential target based on maximum observed can be viewed relative to trends in oyster coverage over time.
Summary
Both options use different approaches to developing targets. Option 1 prioritizes areas where oysters could be (high habitat suitability) regardless of current extent, whereas option 2 prioritizes areas where oysters have been regardless of priority habitat. Each option has tradeoffs.
Option 1 may be more easily attained in some bay segments (e.g., Old Tampa Bay, Terra Ceia Bay) and more difficult in others (e.g., Hillsborough Bay, Manatee River).
For option 2, no bay segments are currently achieving the potential targets, whereas targets may be more easily achieved in some bay segments (e.g., Hillsborough Bay, Manatee River) and more difficult in others (e.g., Old Tampa Bay, Boca Ciega Bay).
Option 2 provides a more equitable distribution of targets across the bay segments, whereas option 1 provides lower priority to bay segments with higher oyster coverage compared to others.
Option 1 also provides two alternatives, one using both OHSI categories 14 and 15 or only category 15. Differences in targets using either alternative vary by bay segment – one alternative is not consistently higher or lower than the other.
Option 2 is inclusive of the recommended 175 acres of restoration in Old Tampa Bay under the assimilative capacity project.
Using the current oyster coverage, the following table shows the necessary increase (or decrease if already attained) in oyster coverage to achieve potential targets under both options.