# CW, NW by month -----------------------------------------------------------------------------
otbcei4 <- otbdat |>
nest() |>
crossing(
chlmax = seq(0, 50, length.out = 100),
season = list(1:3, 4:6, 7:9, 10:12)
) |>
mutate(
data = purrr::pmap(list(chlmax, season, data), function(chlmax, season, data){
data |>
mutate(
chla = case_when(
mo %in% season & subsegment %in% c('CW', 'NW') ~ pmin(chla, chlmax),
T ~ chla
)
)
}),
attain = purrr::map(data, function(x){
anlz_avedat(x)$ann |>
dplyr::filter(var %in% 'mean_chla') %>%
dplyr::left_join(targets, by = 'bay_segment') %>%
dplyr::select(bay_segment, yr, var, val, thresh = chla_thresh) %>%
dplyr::mutate(
attain = val < thresh
)
}),
allattain = purrr::map(attain, function(x){
sum(x$attain) / nrow(x)
}),
lastra = purrr::map(attain, function(x){
attain <- x |> filter(yr >= 2017) |> pull(attain) |> sum()
attain / 5
})
)
toplo4 <- otbcei4 |>
select(chlmax, season, allattain, lastra) |>
unnest(allattain) |>
unnest(lastra) |>
unnest(season) |>
mutate(
season = case_when(
season %in% 1:3 ~ 'JFM',
season %in% 4:6 ~ 'AMJ',
season %in% 7:9 ~ 'JAS',
season %in% 10:12 ~ 'OND'
)
) |>
distinct() |>
pivot_longer(-c(chlmax, season)) |>
mutate(
name = factor(name, levels = c('allattain', 'lastra'), labels = c('Since 2000', '2017-2021 RA')),
season = factor(season, levels = c('JFM', 'AMJ', 'JAS', 'OND'))
)
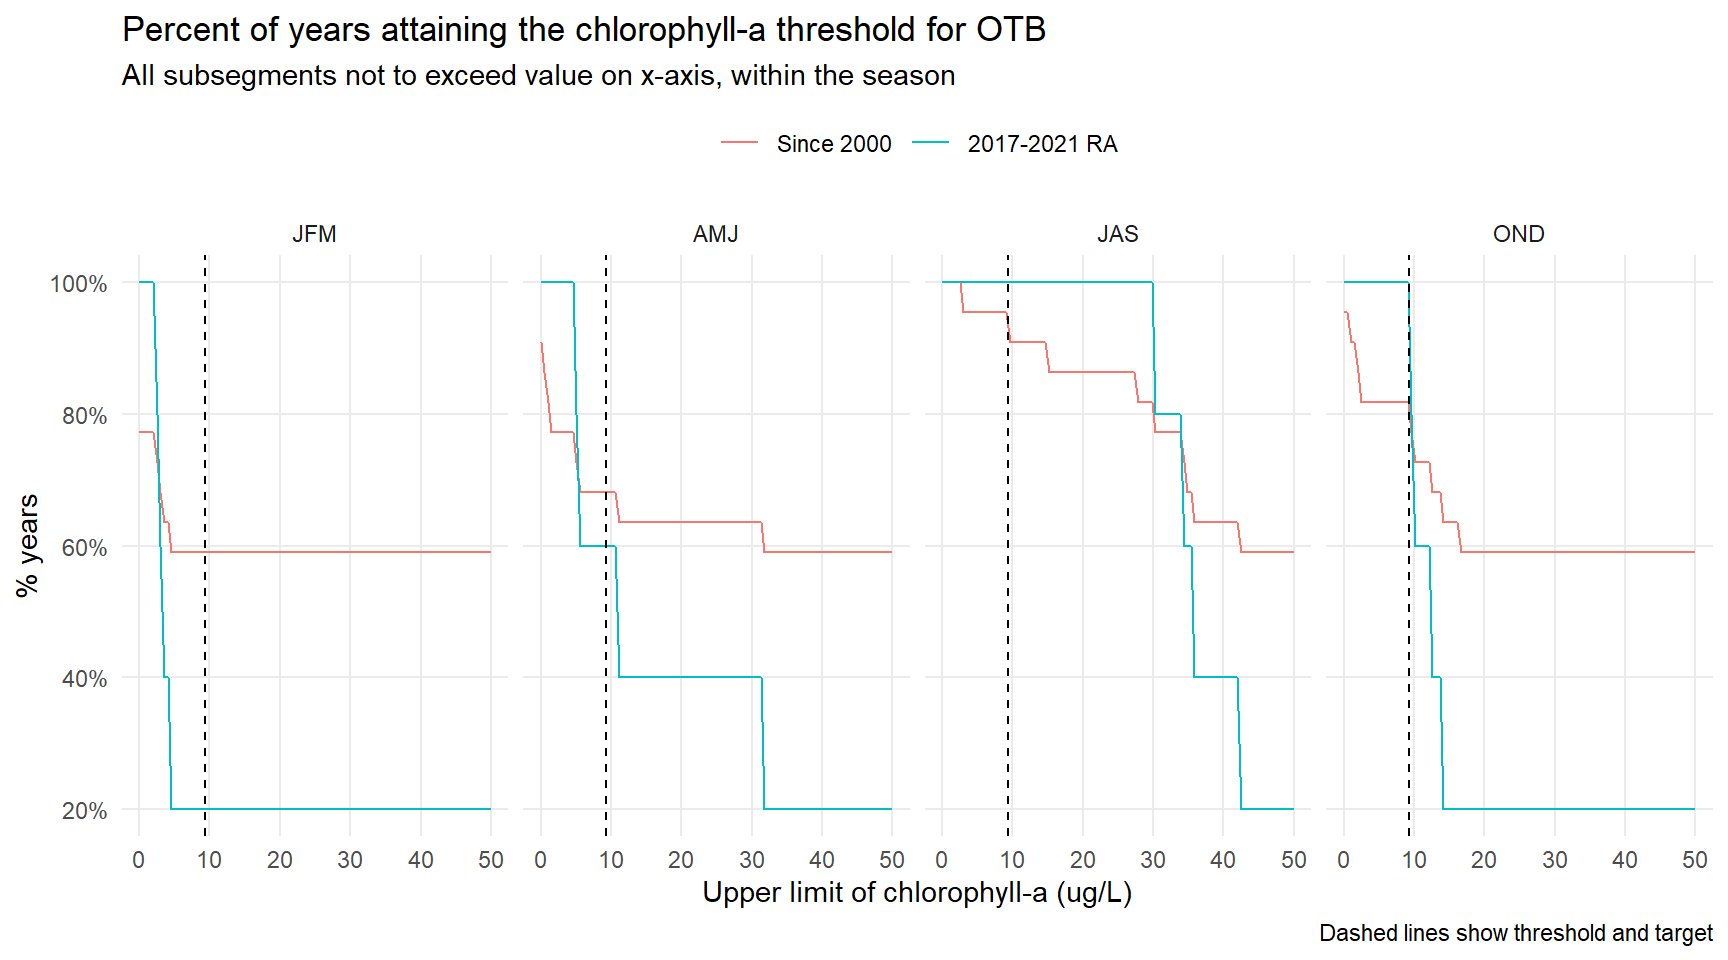
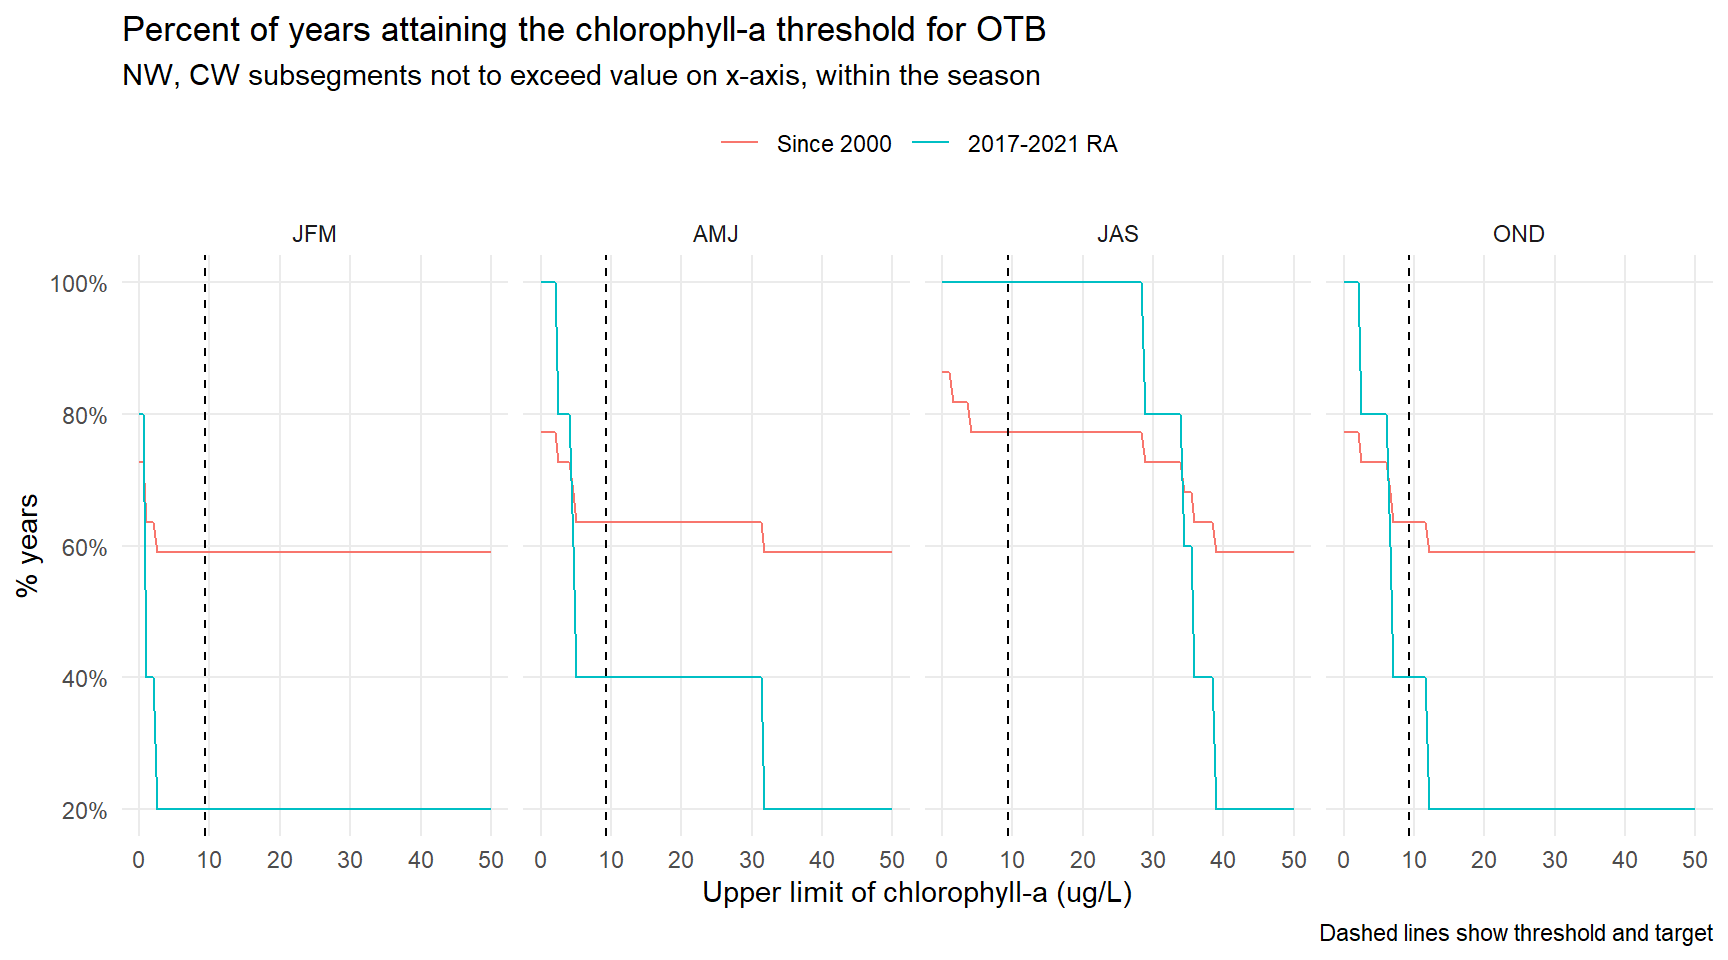
# percent attained
ggplot(toplo4, aes(x = chlmax, y = value, color = name)) +
geom_line() +
geom_vline(xintercept = 9.3, linetype = 'dashed') +
scale_y_continuous(labels = scales::percent) +
theme_minimal() +
facet_wrap(~season, ncol = 4) +
theme(
panel.grid.minor = element_blank(),
legend.position = 'top'
) +
labs(
x = 'Upper limit of chlorophyll-a (ug/L)',
y = '% years',
title = 'Percent of years attaining the chlorophyll-a threshold for OTB',
subtitle = 'NW, CW subsegments not to exceed value on x-axis, within the season',
caption = 'Dashed lines show threshold and target',
color = NULL
)