2022 – 2024 LOADING ESTIMATES
Dec 9, 2025
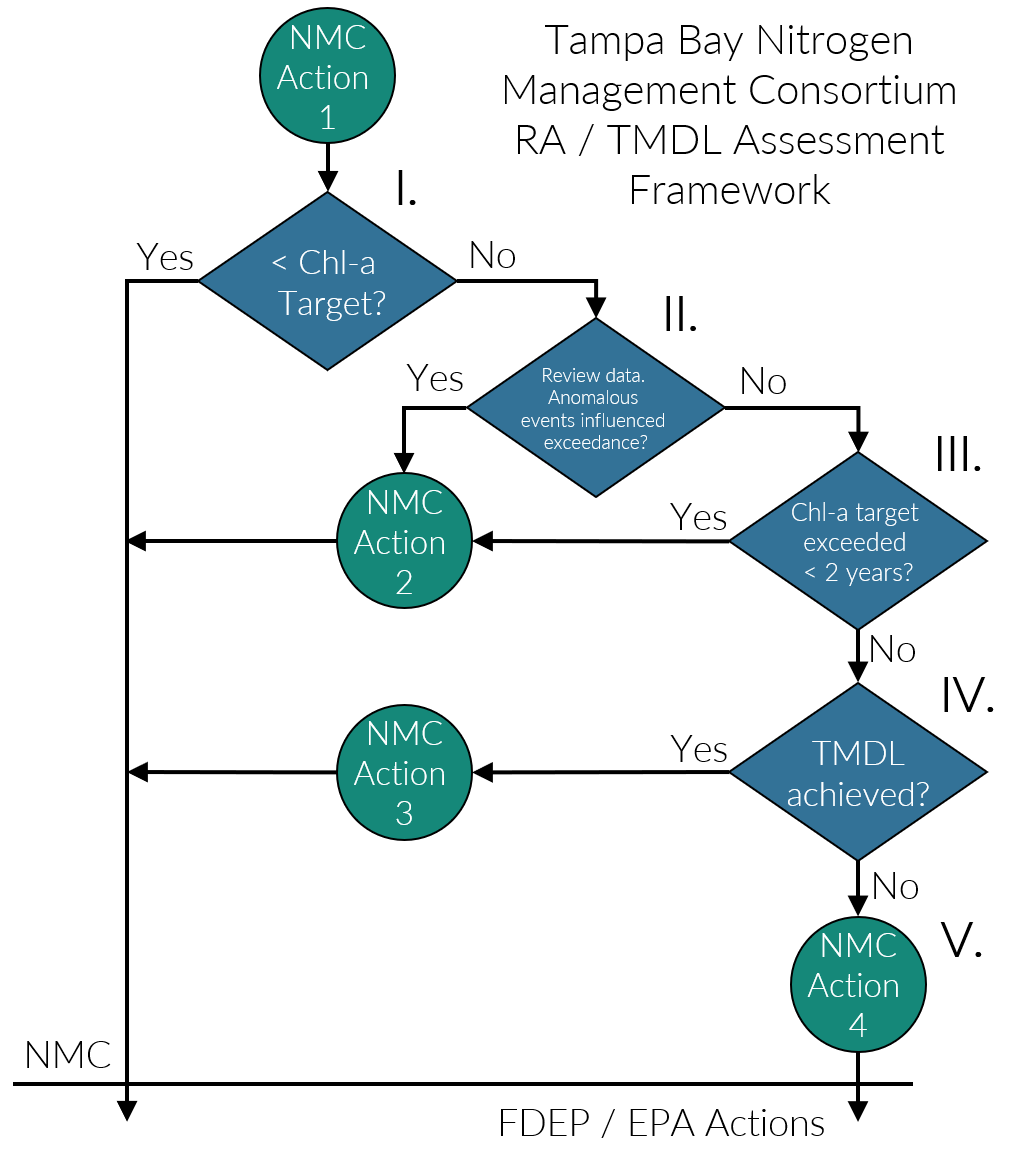
RA FRAMEWORK
- Each year, assess attainment of water quality thresholds
- Loadings only evaluated if water quality thresholds not attained in two consecutive years
- Annual reporting to FDEP, fourth year of 2022 – 2026 RA period
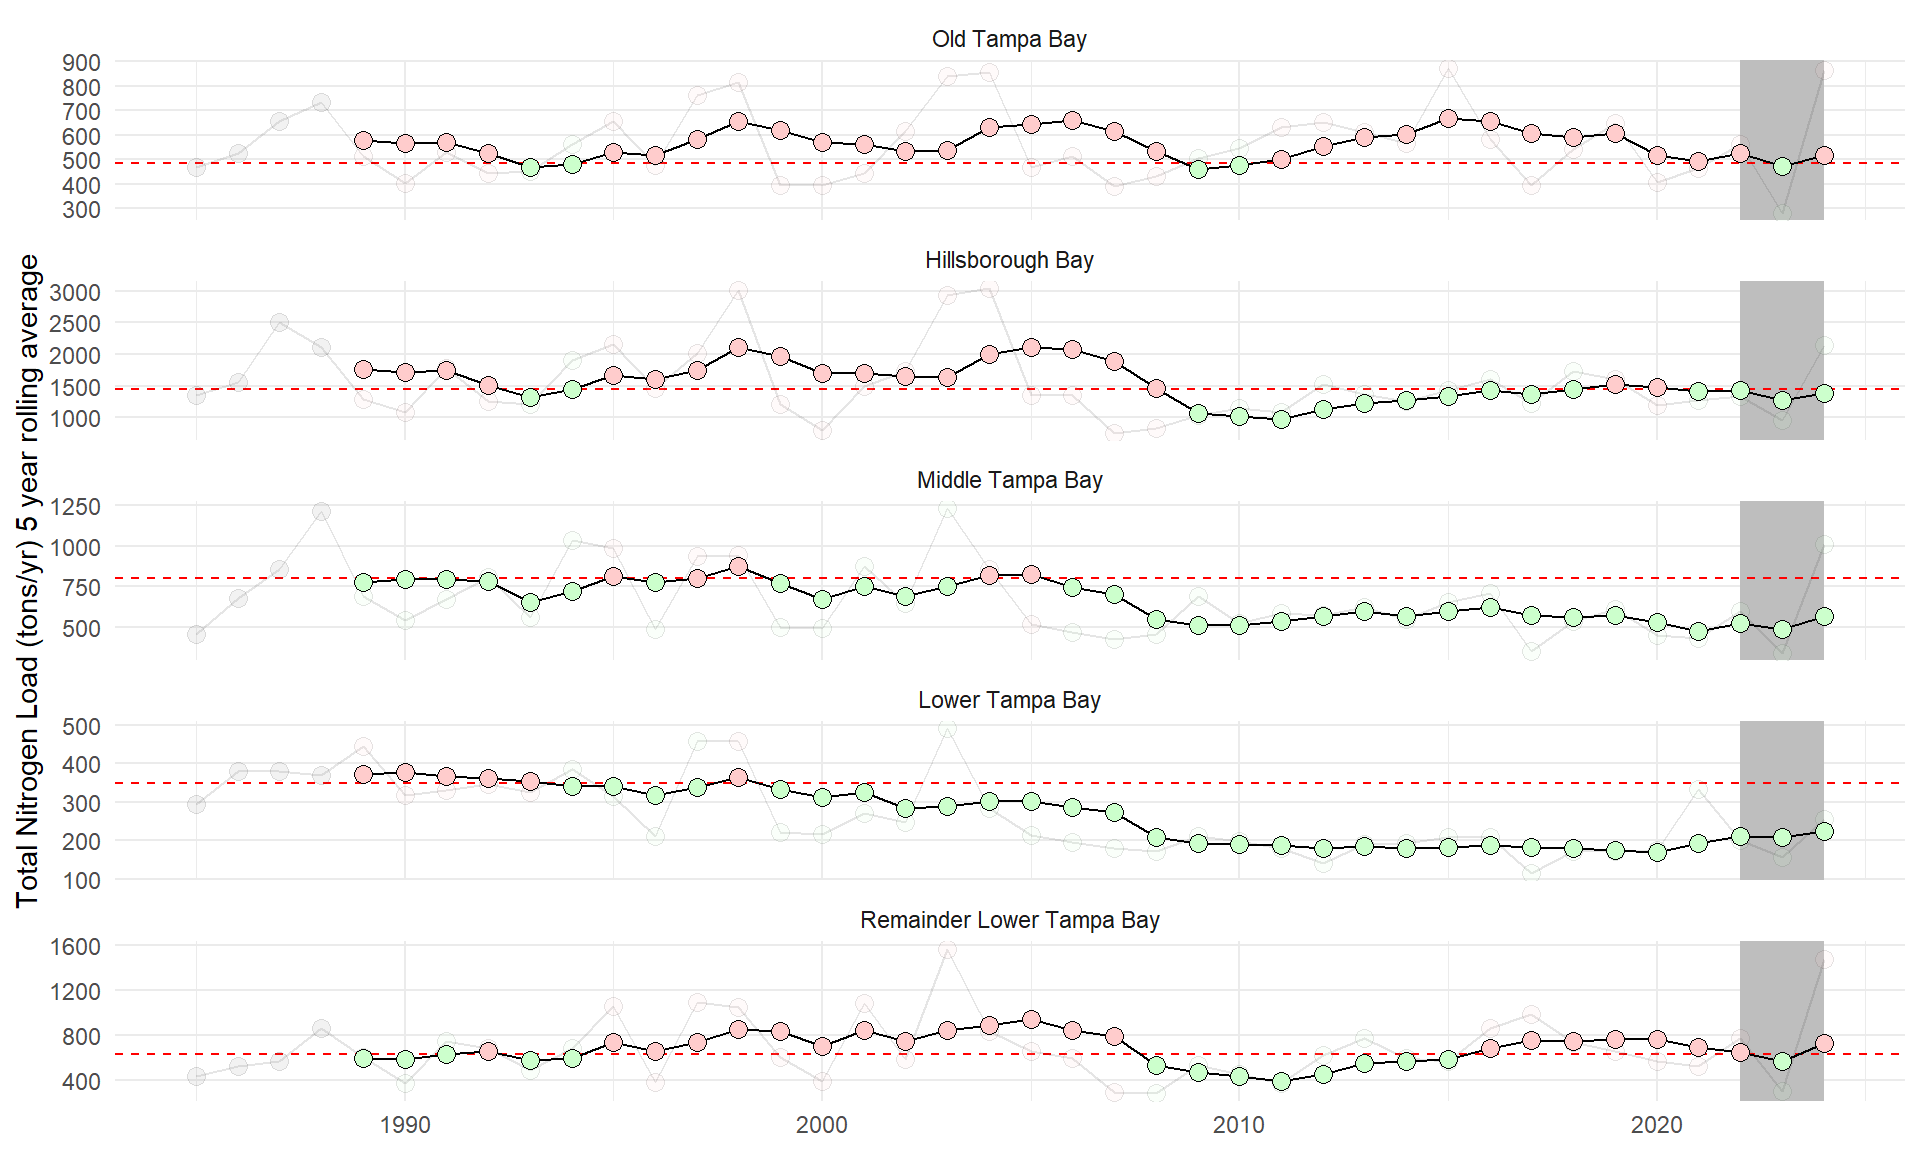
TOTAL LOADS BY SEGMENT
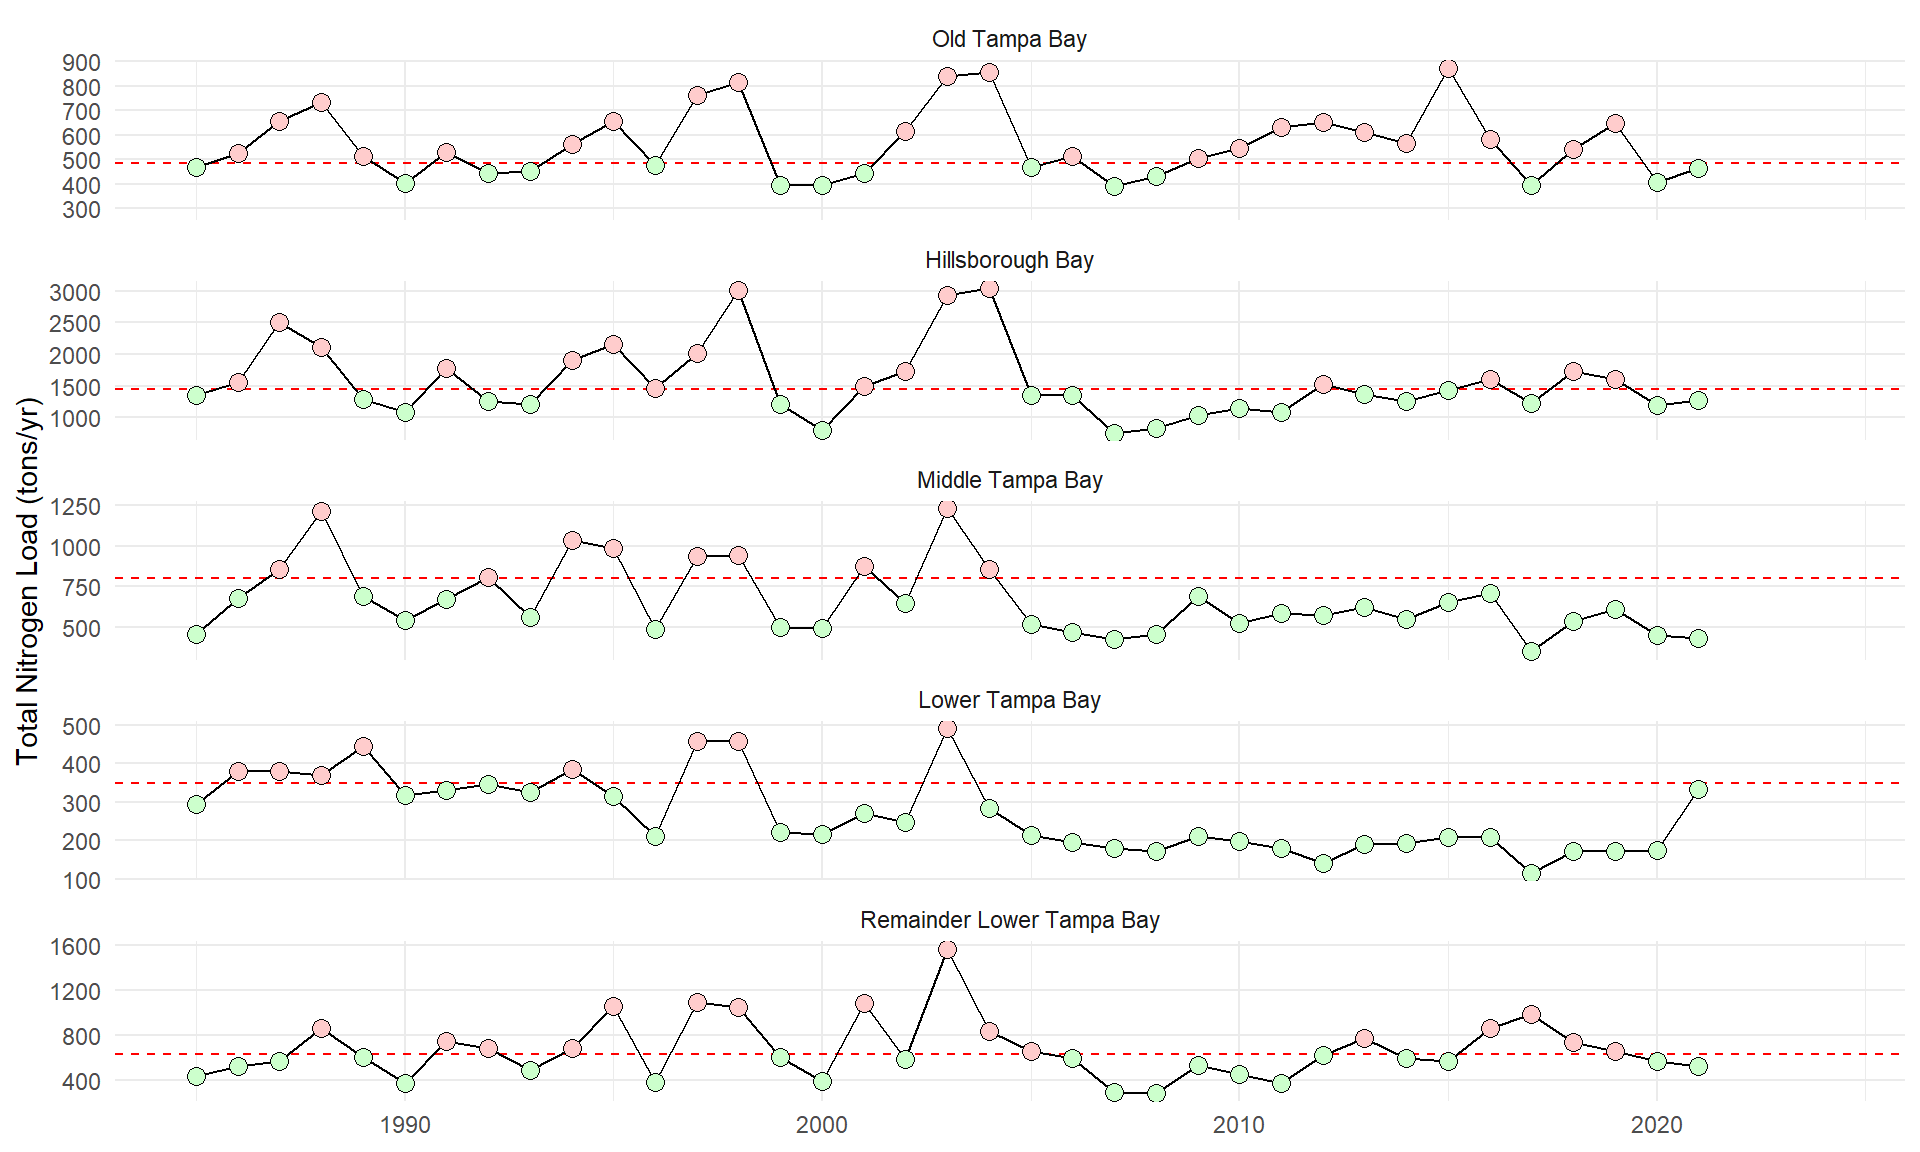
TOTAL LOADS BY SEGMENT
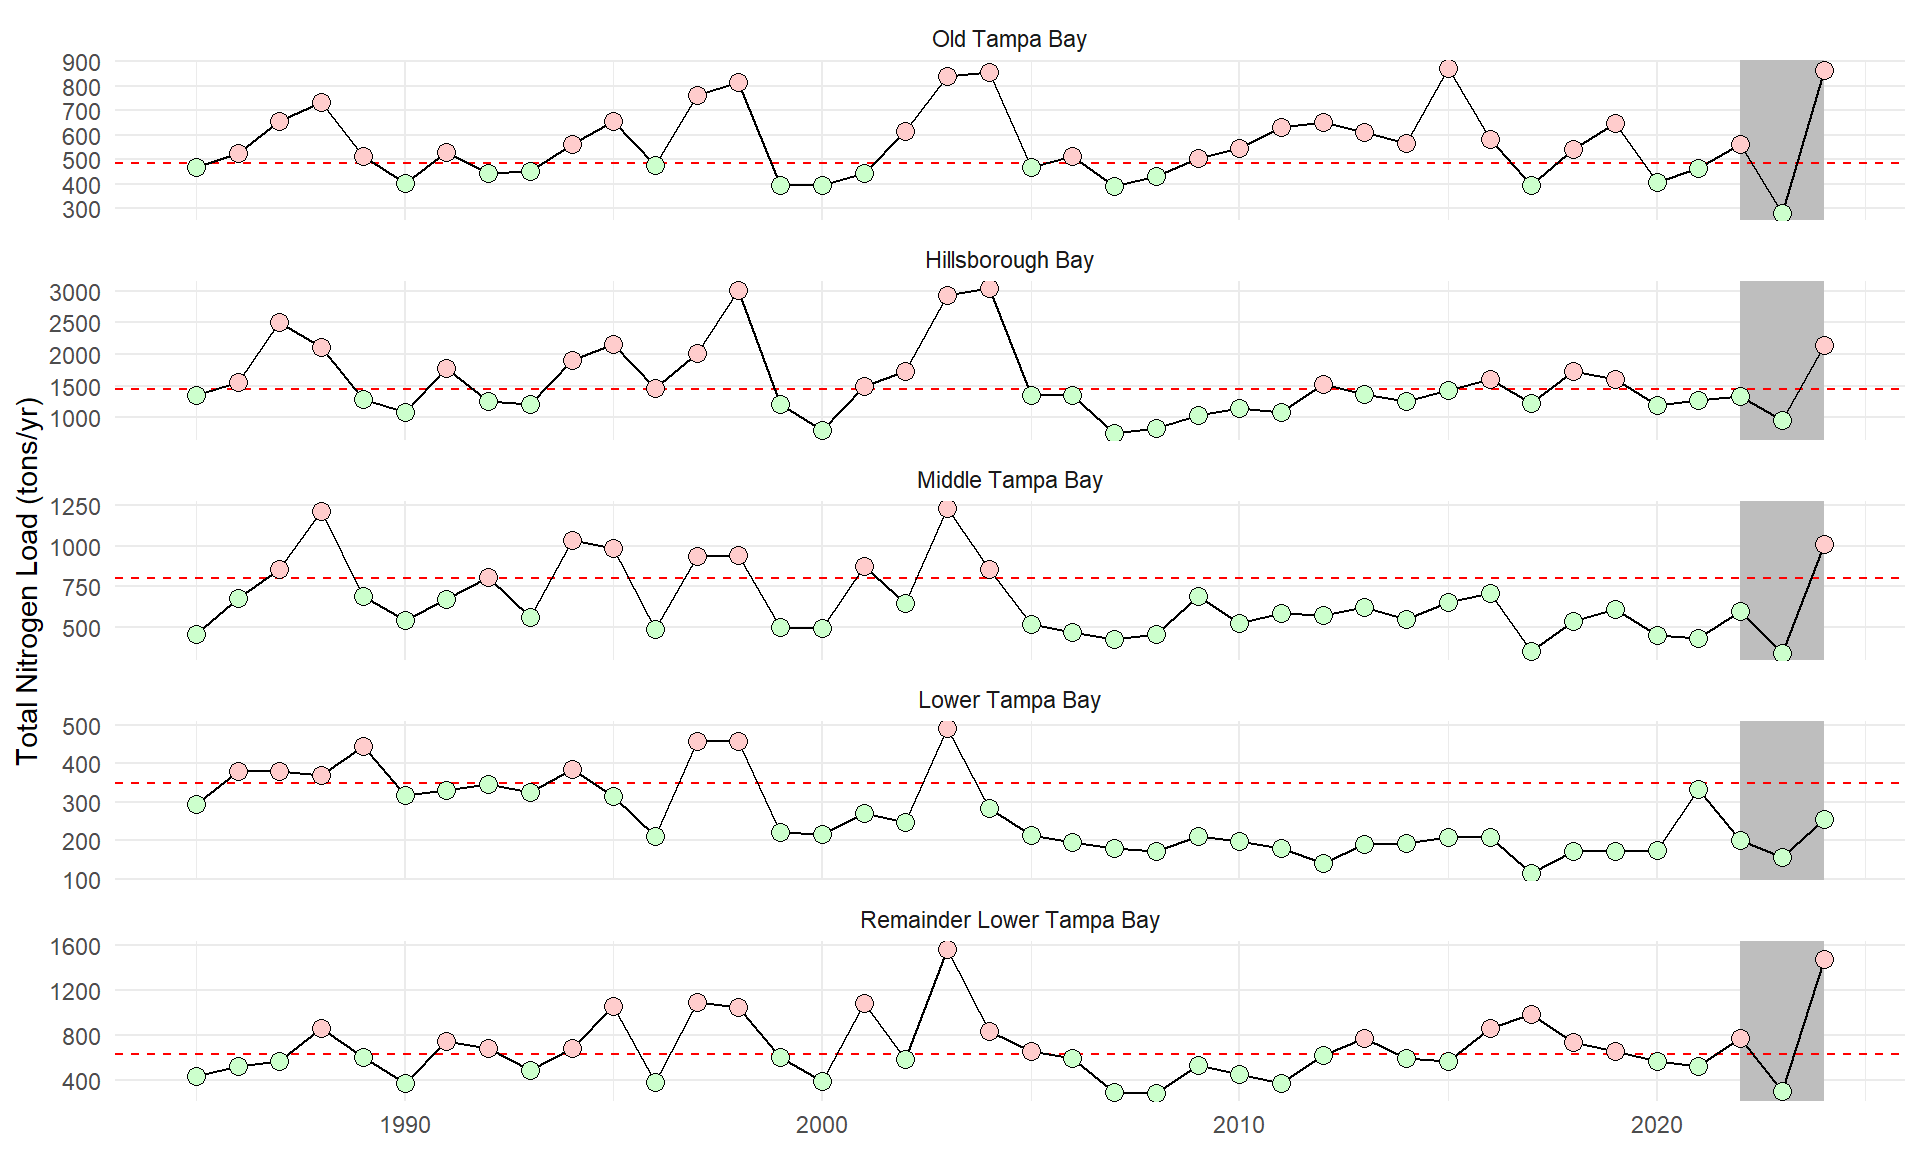
TOTAL LOADS BY SEGMENT
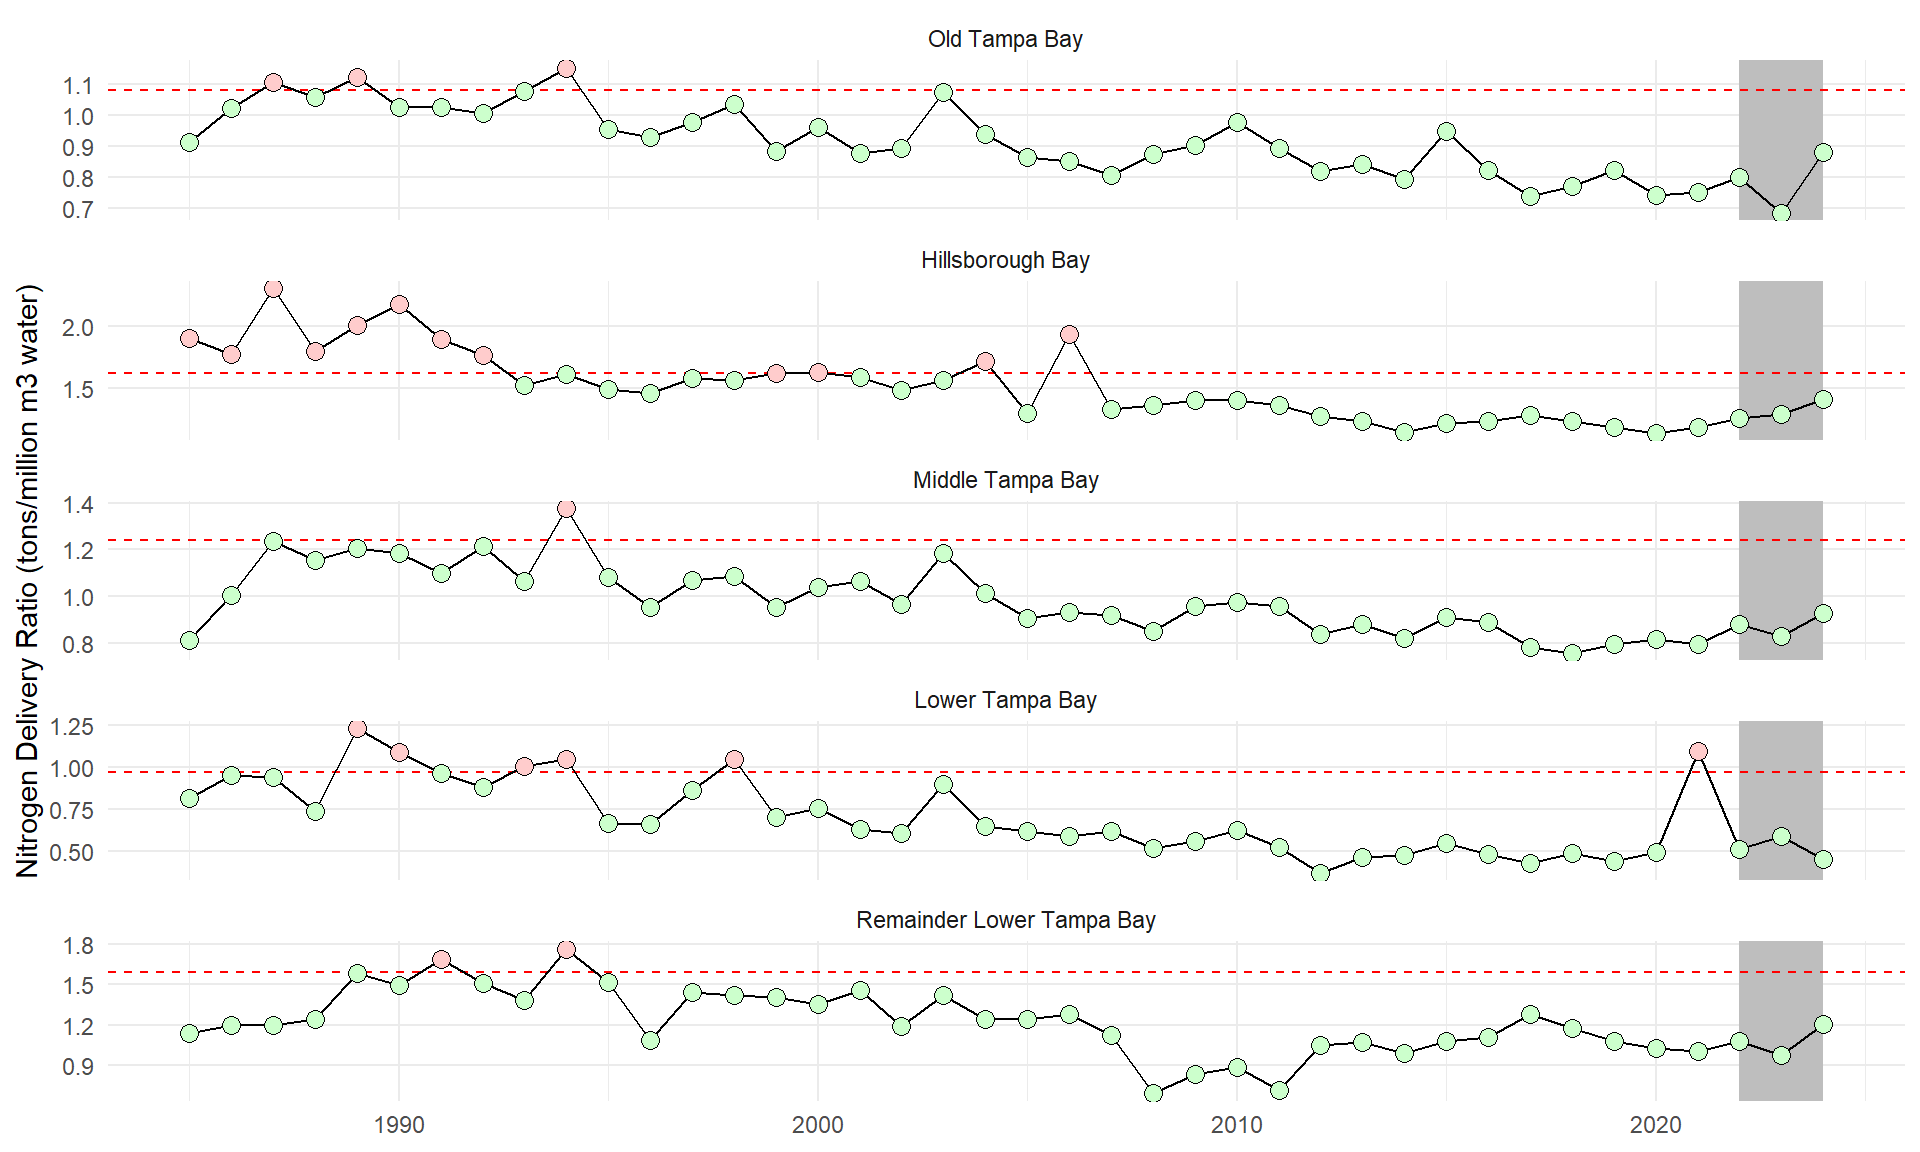
NITROGEN DELIVERY RATIOS
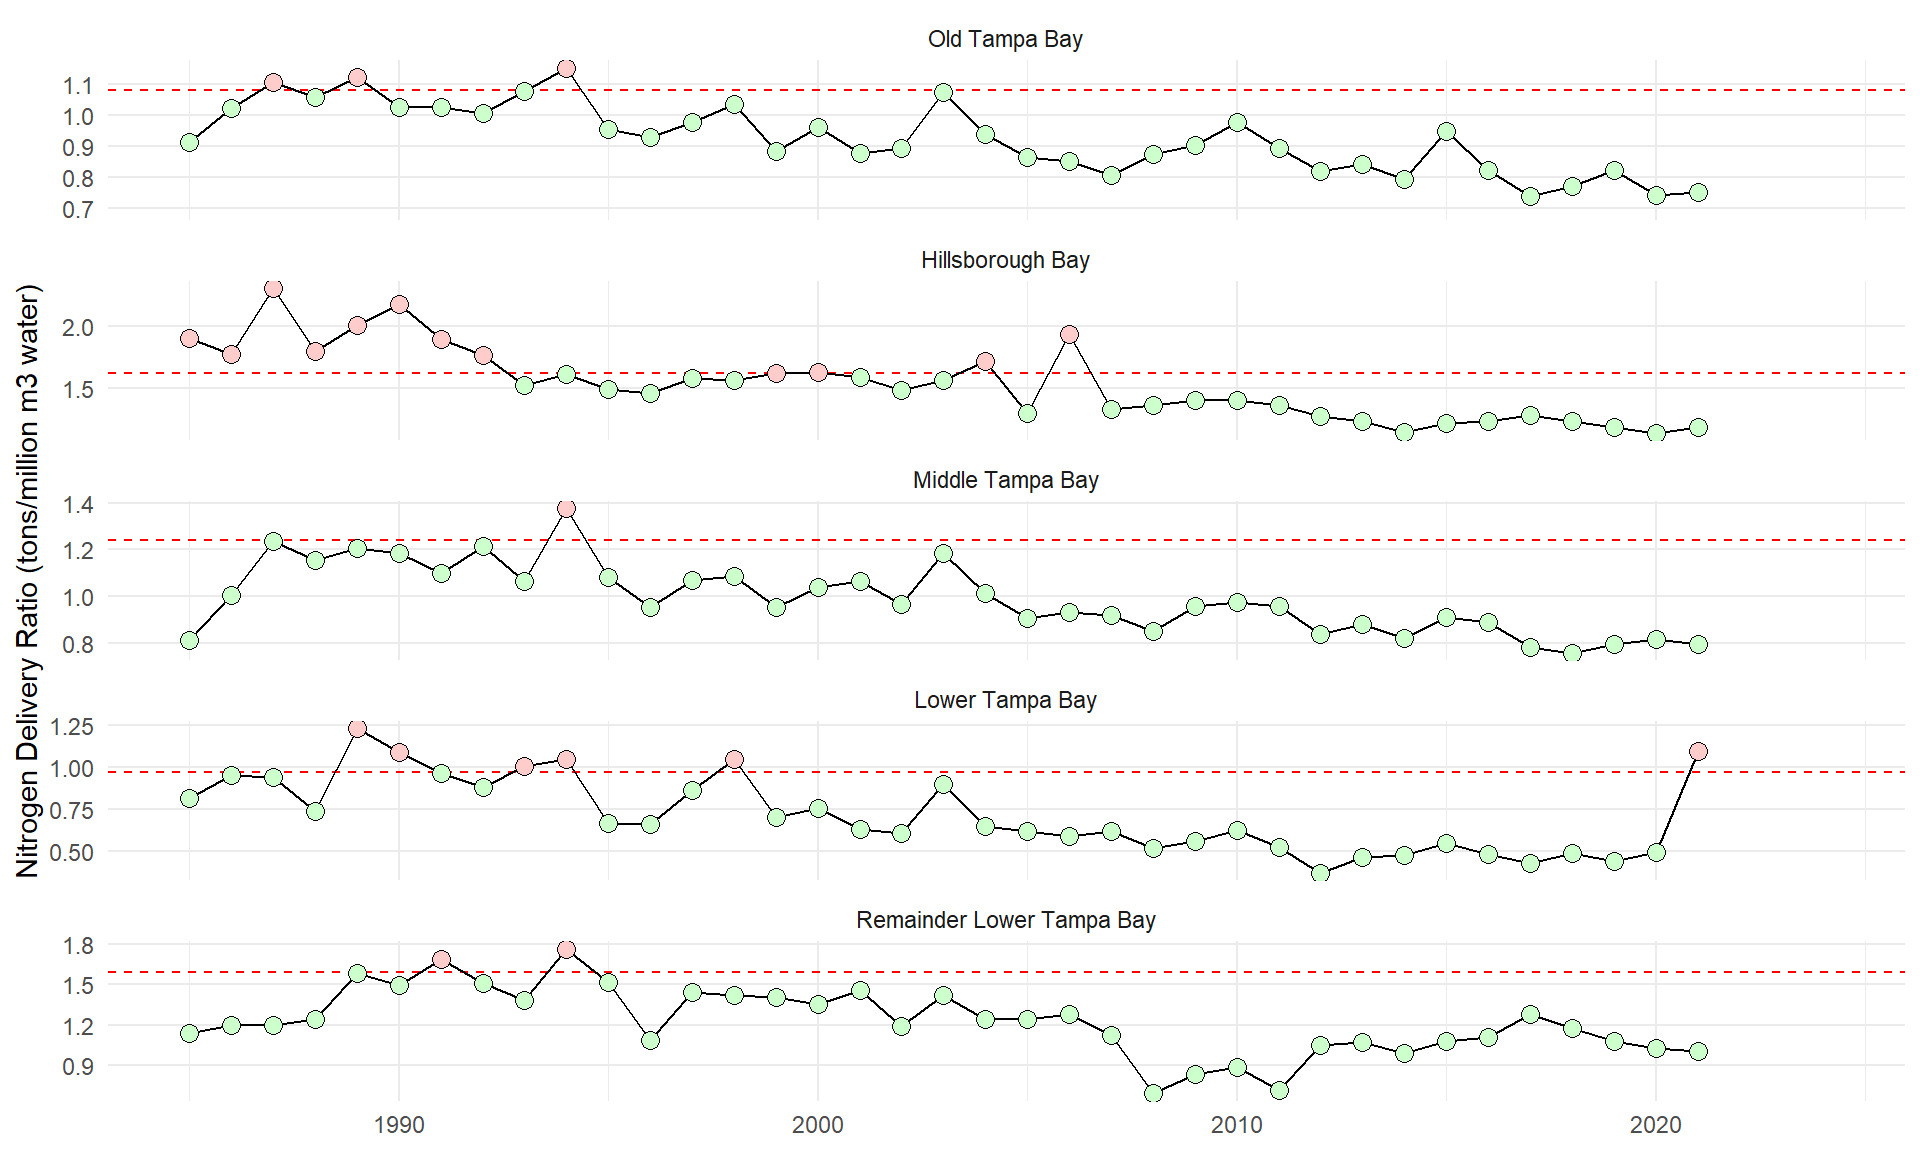
NITROGEN DELIVERY RATIOS
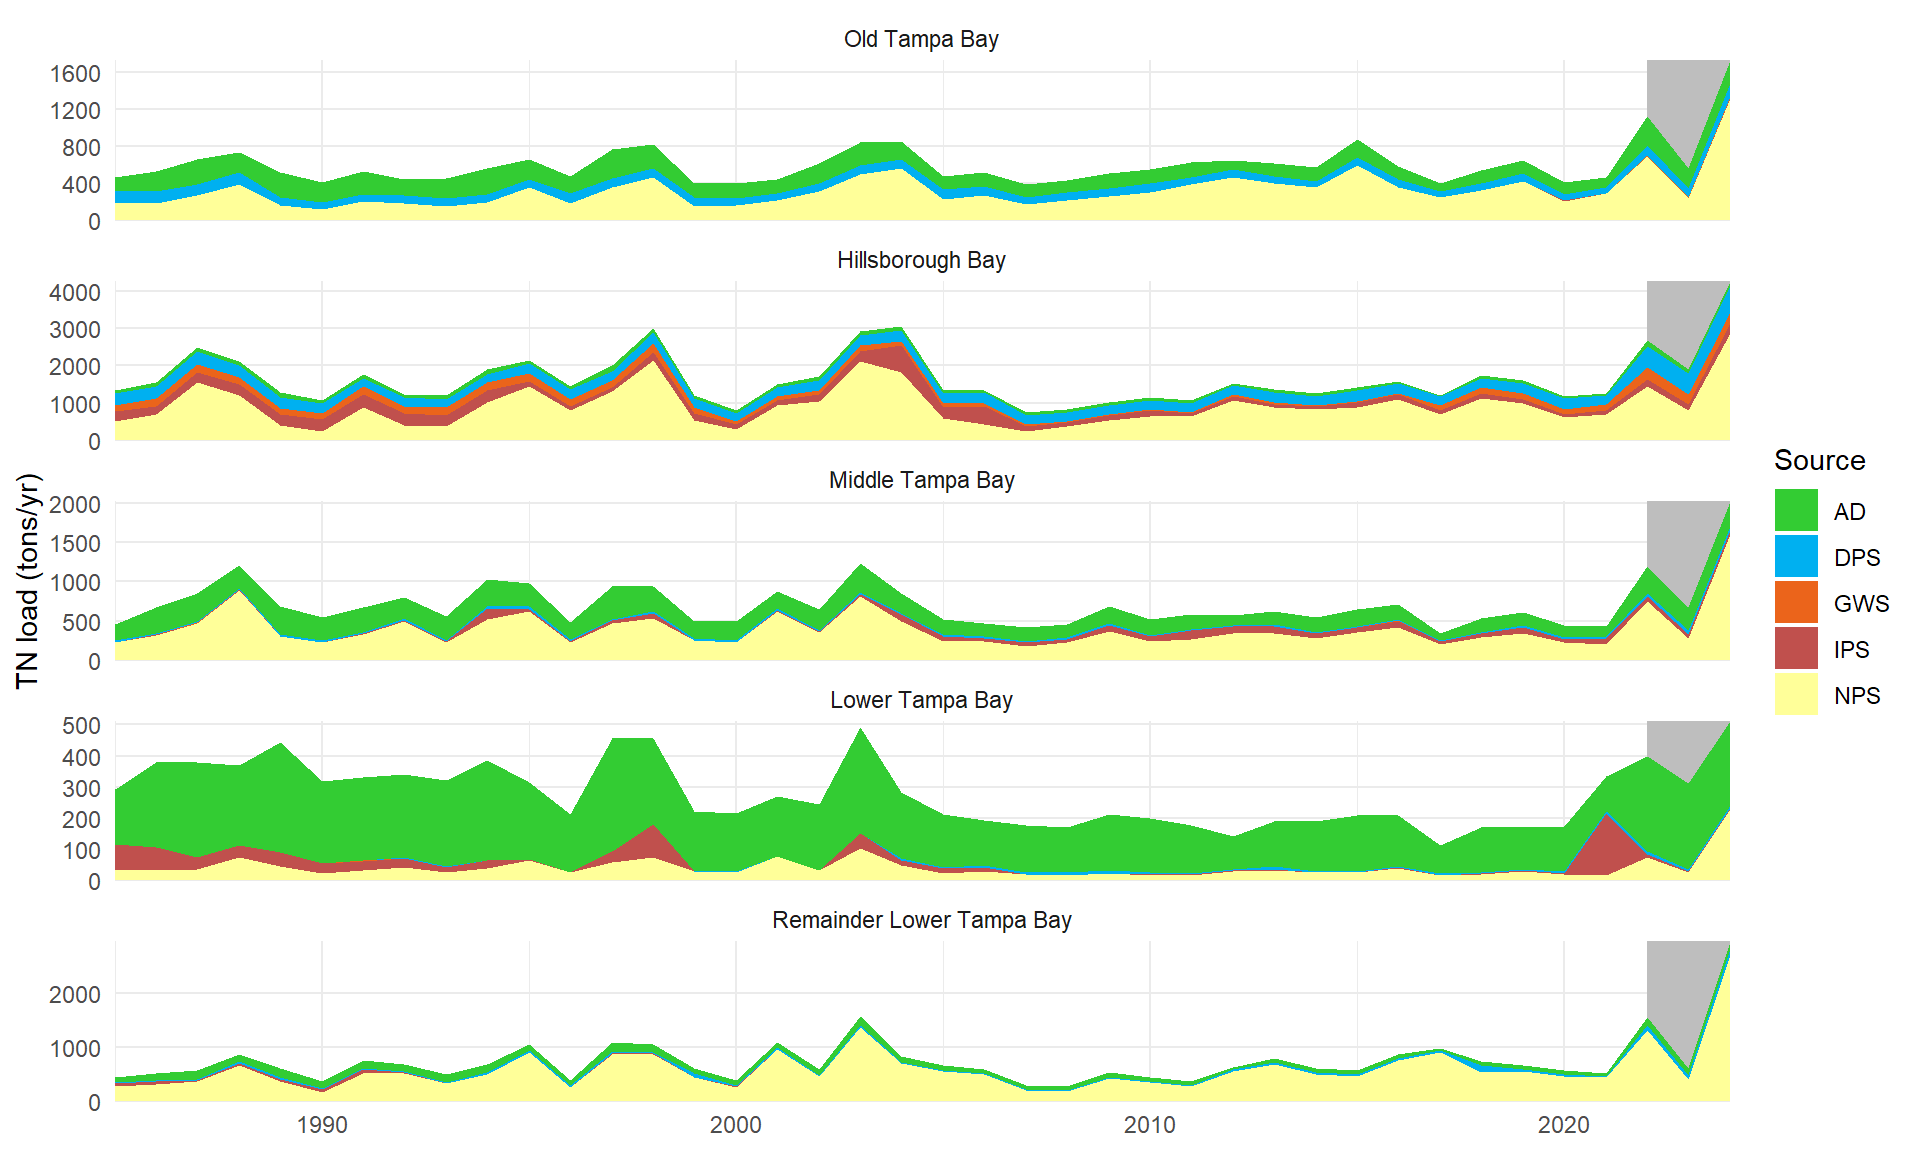
LOADS BY SOURCE
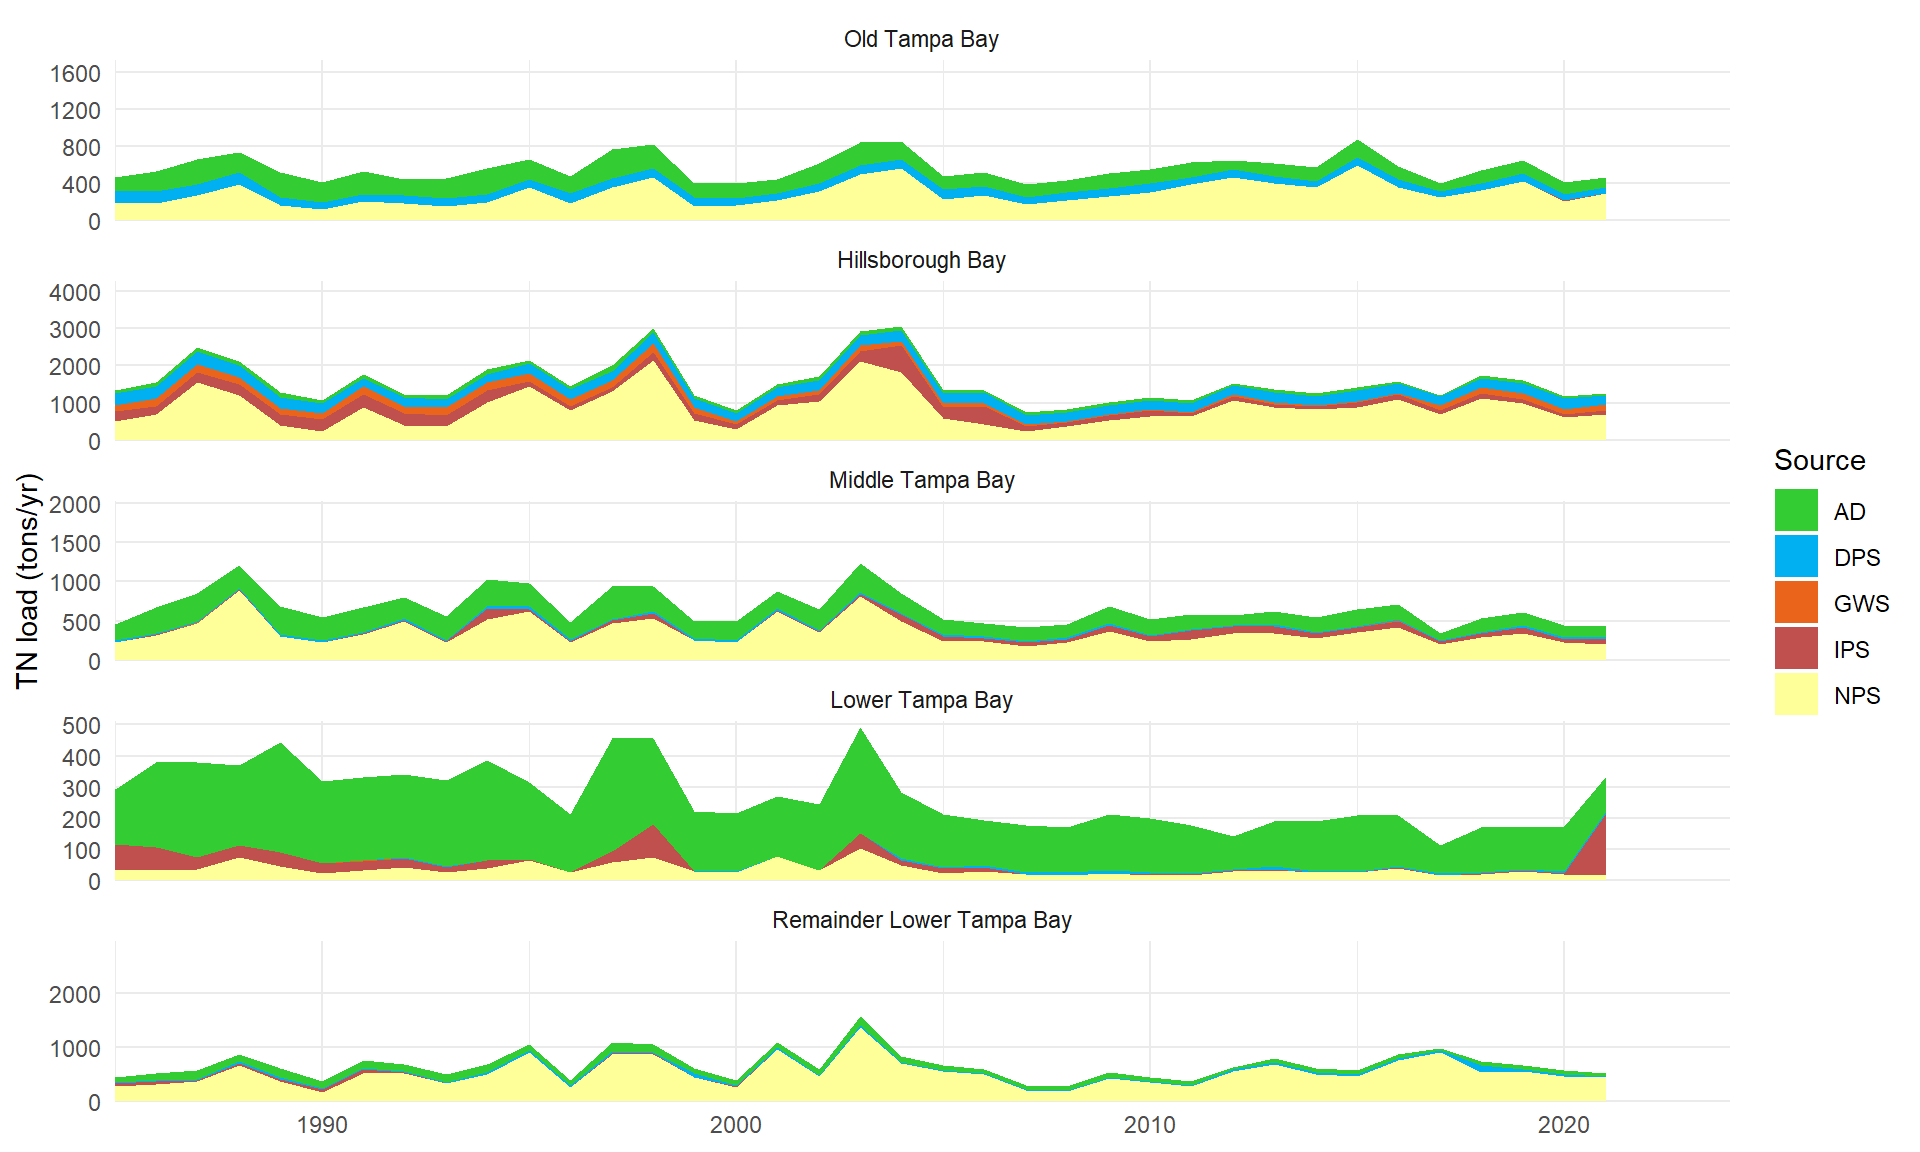
LOADS BY SOURCE
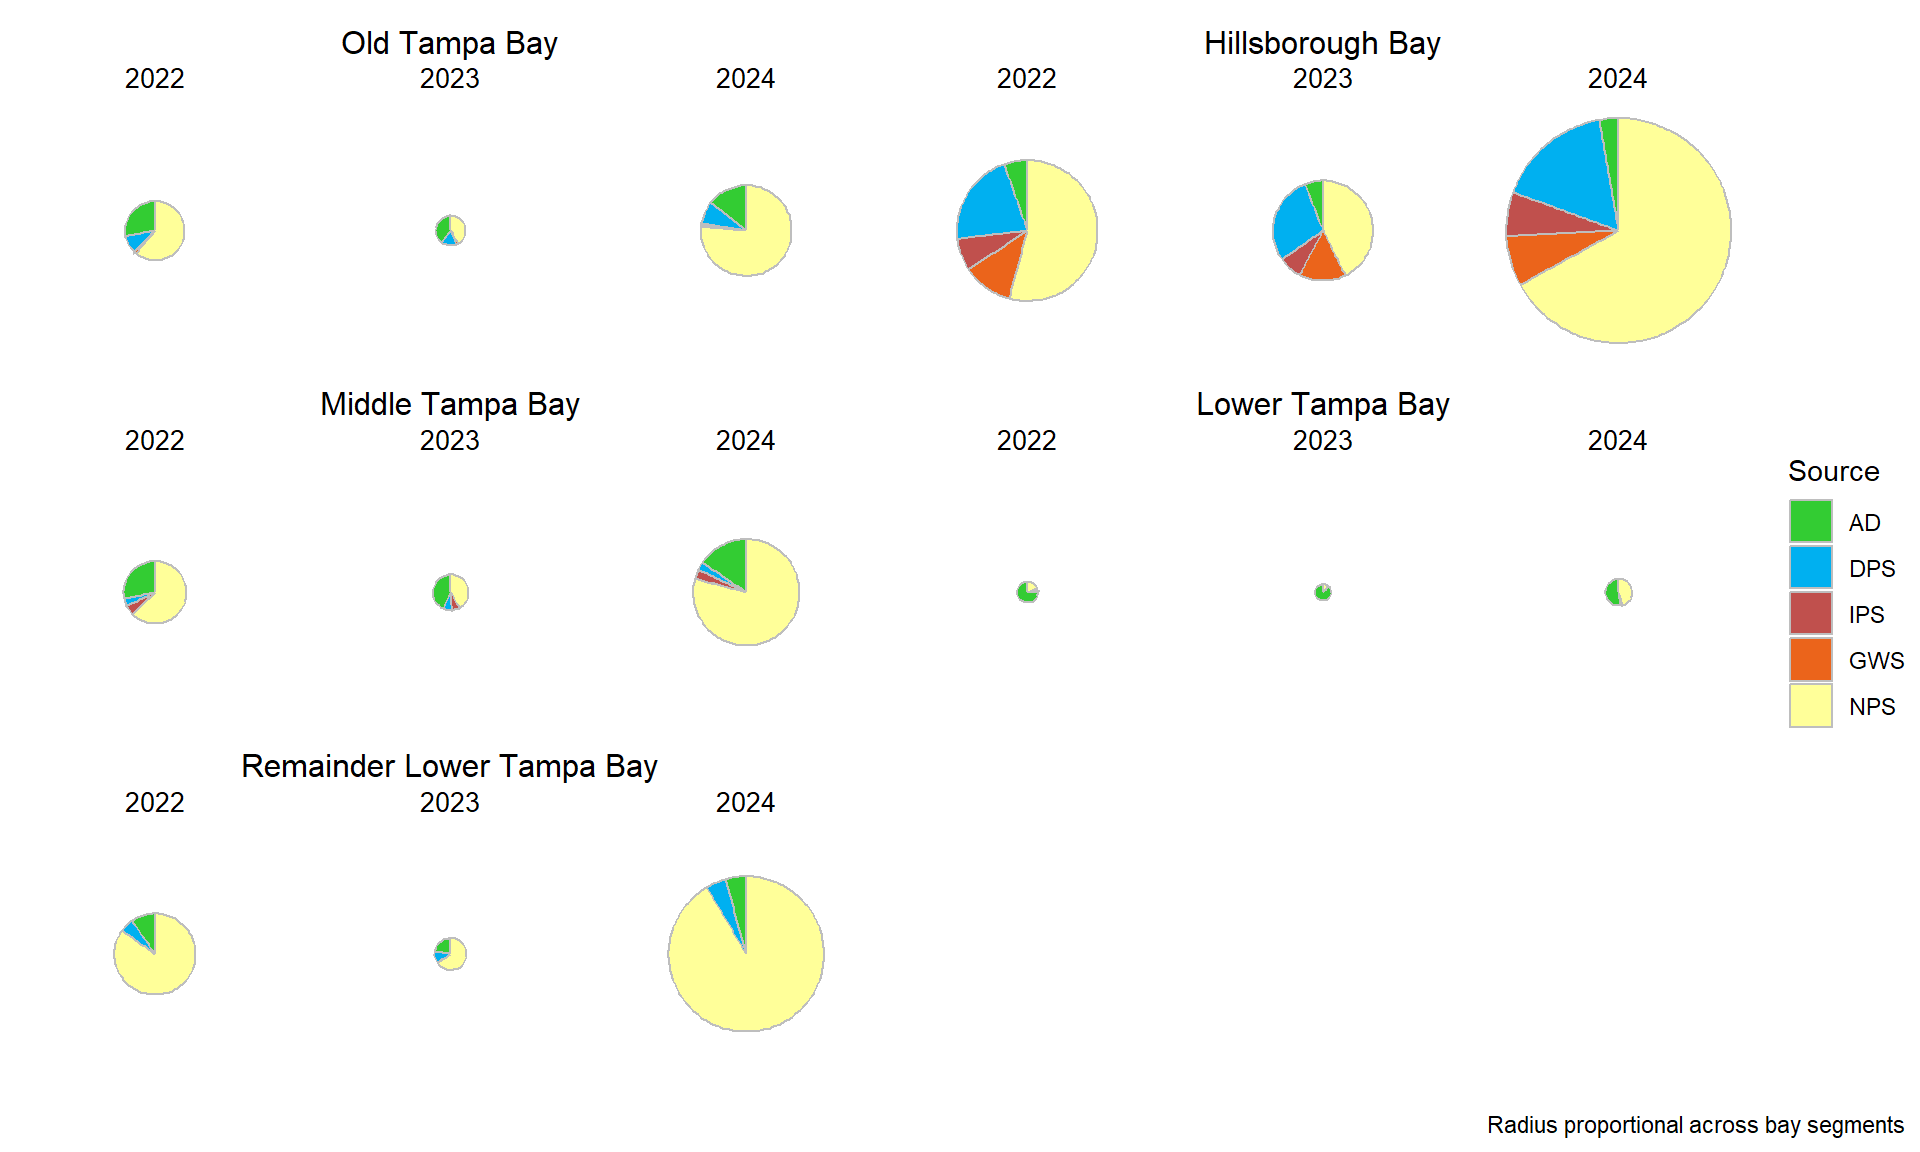
PROPORTIONAL 2022 – 2024
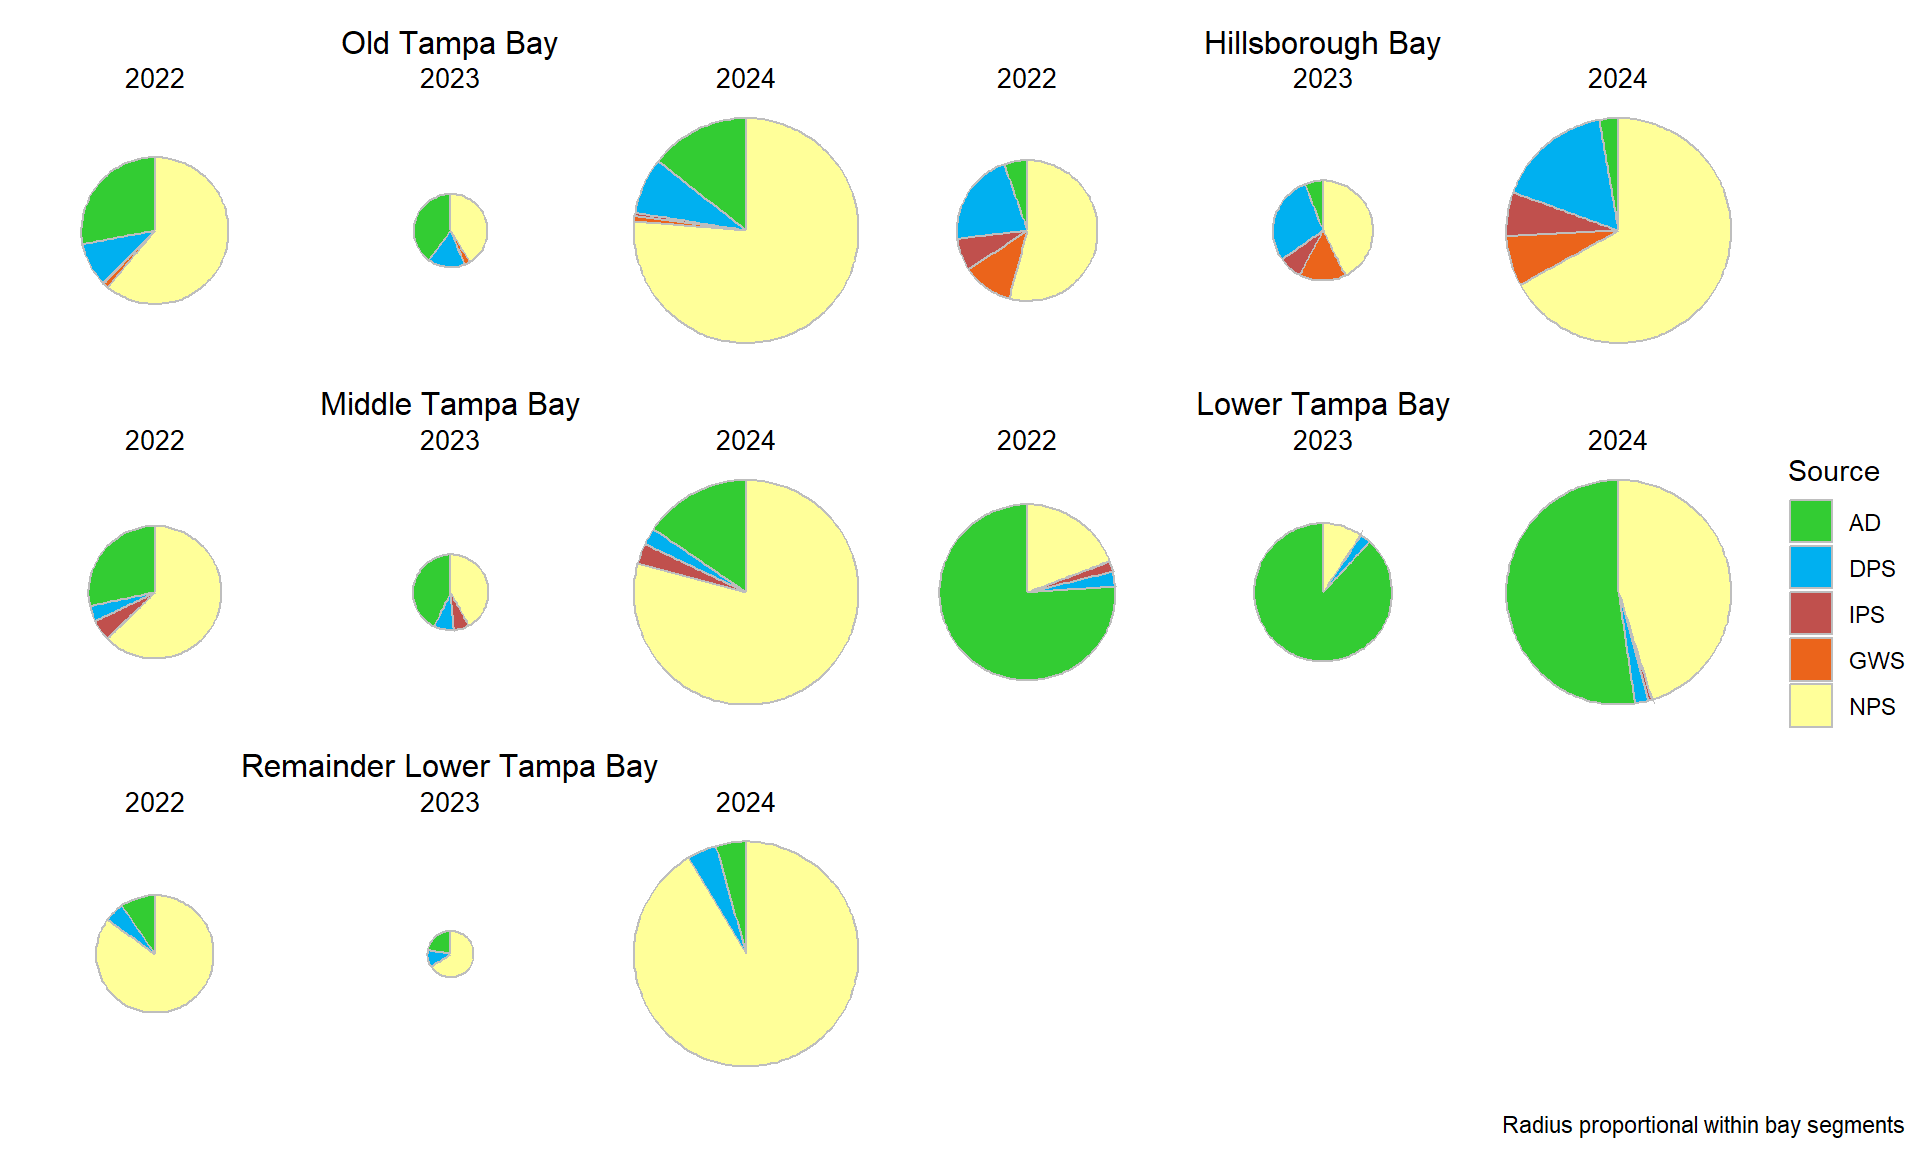
PROPORTIONAL 2022 – 2024
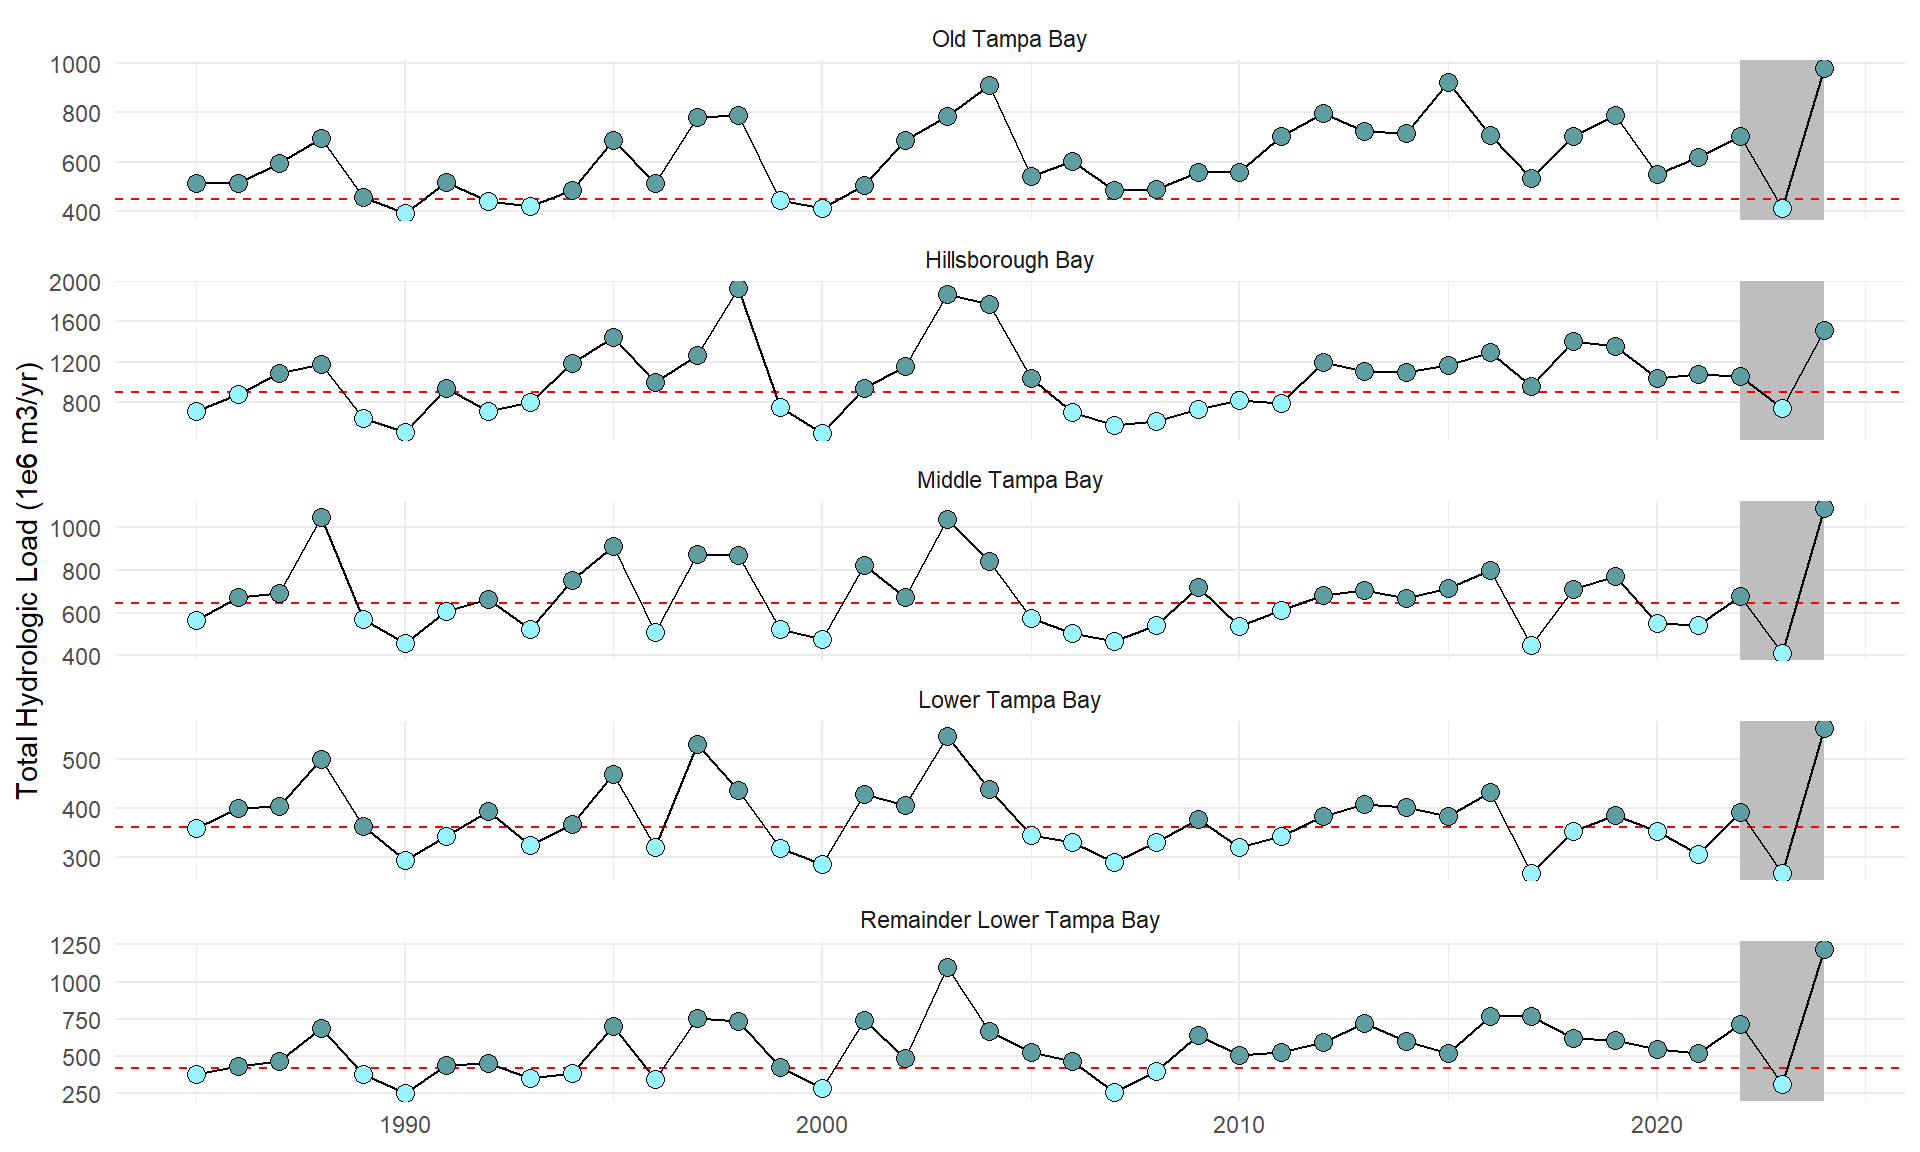
HYDROLOGIC LOADS
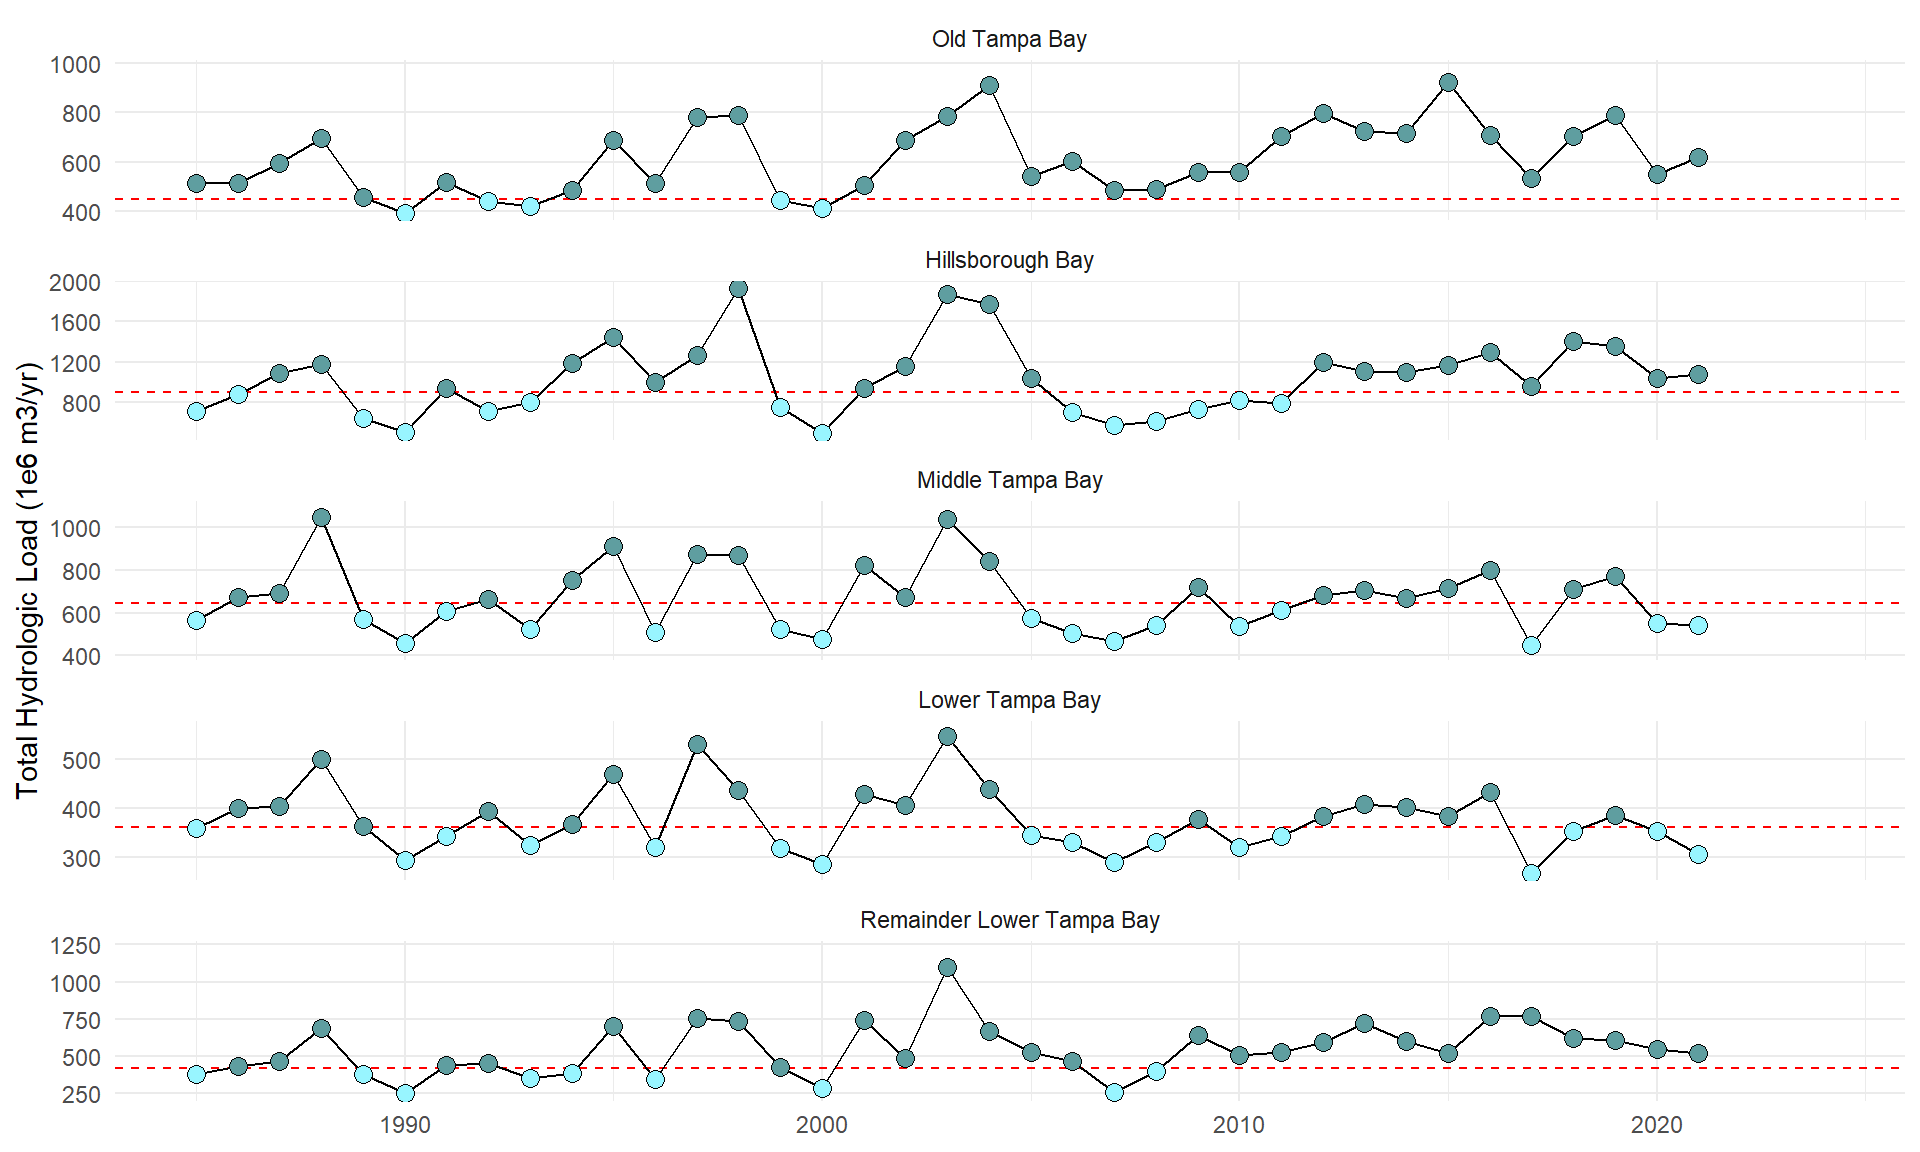
HYDROLOGIC LOADS
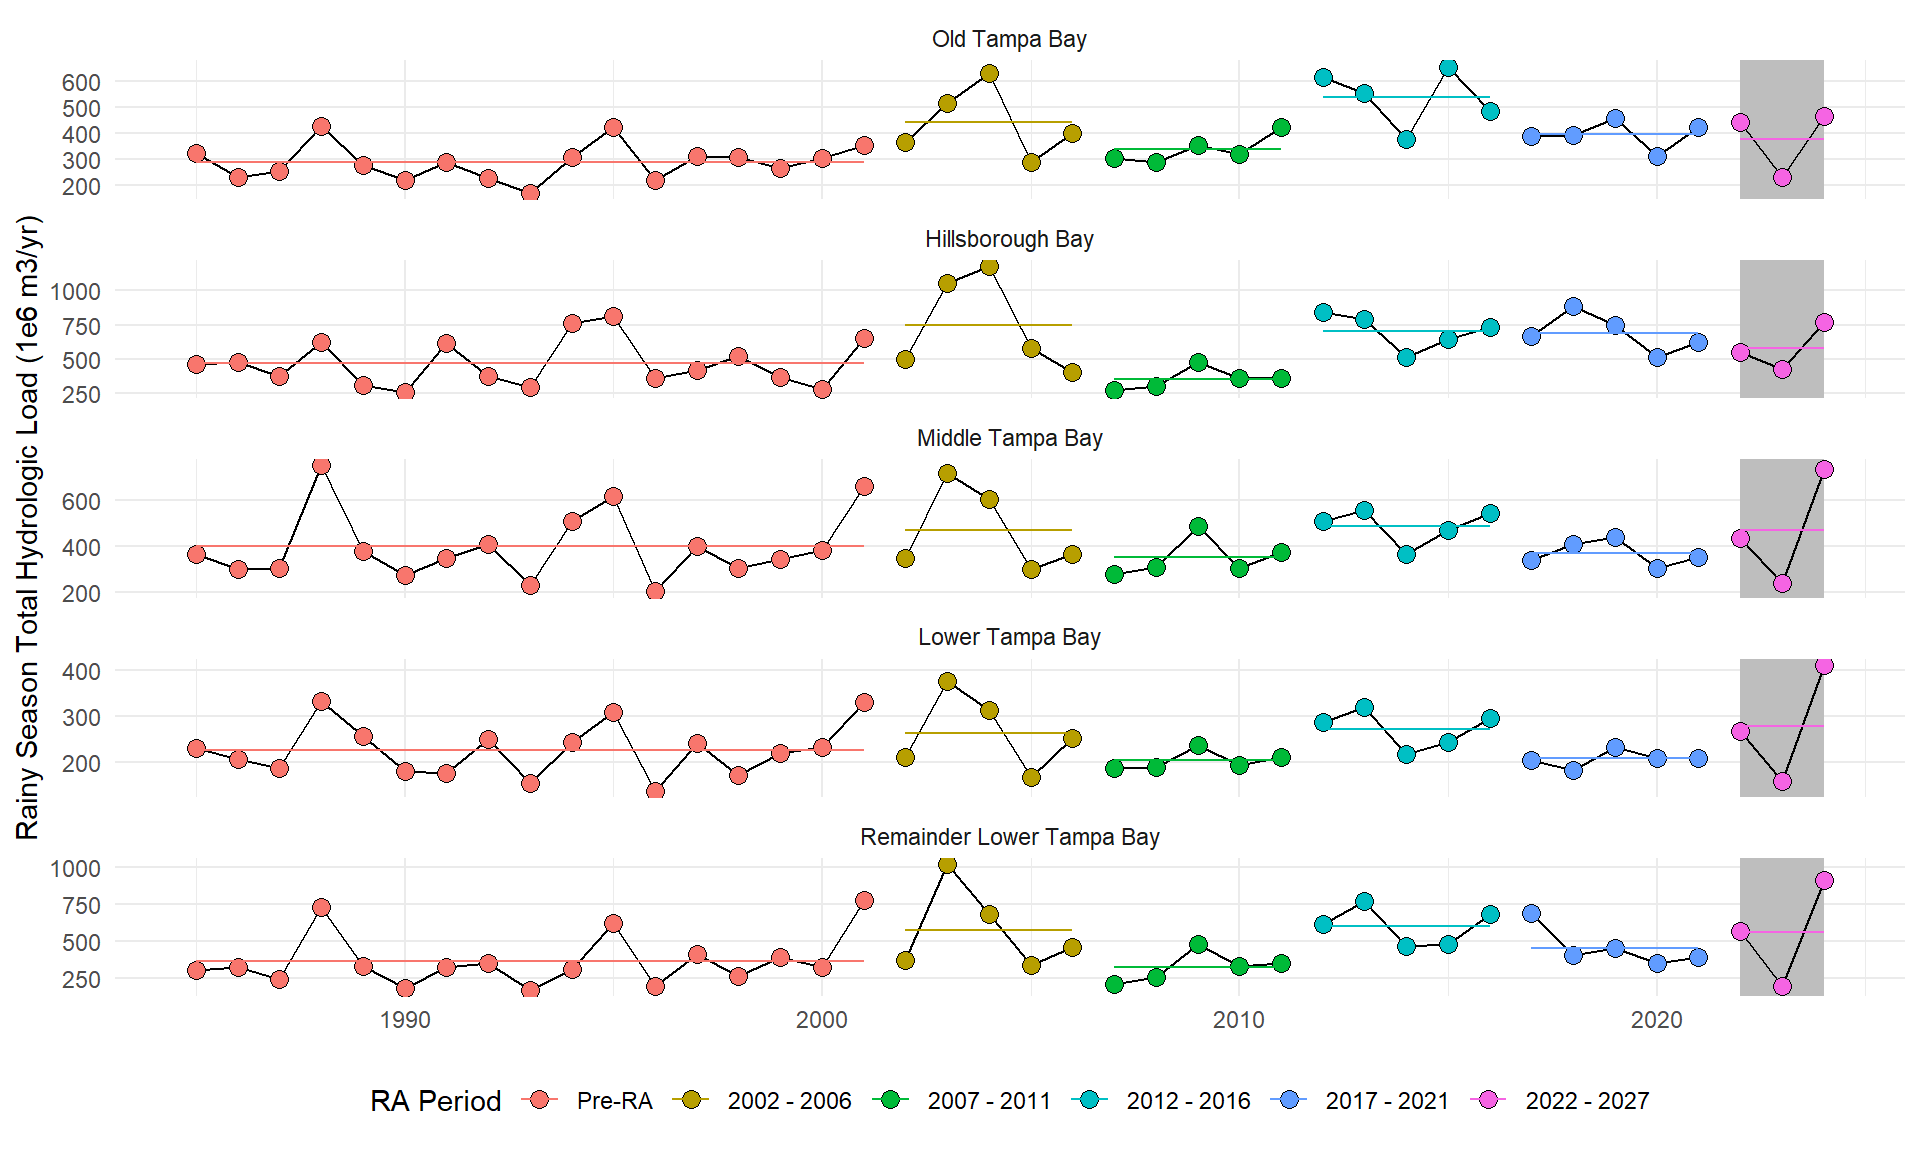
HYDROLOGIC LOADS JUN – SEP
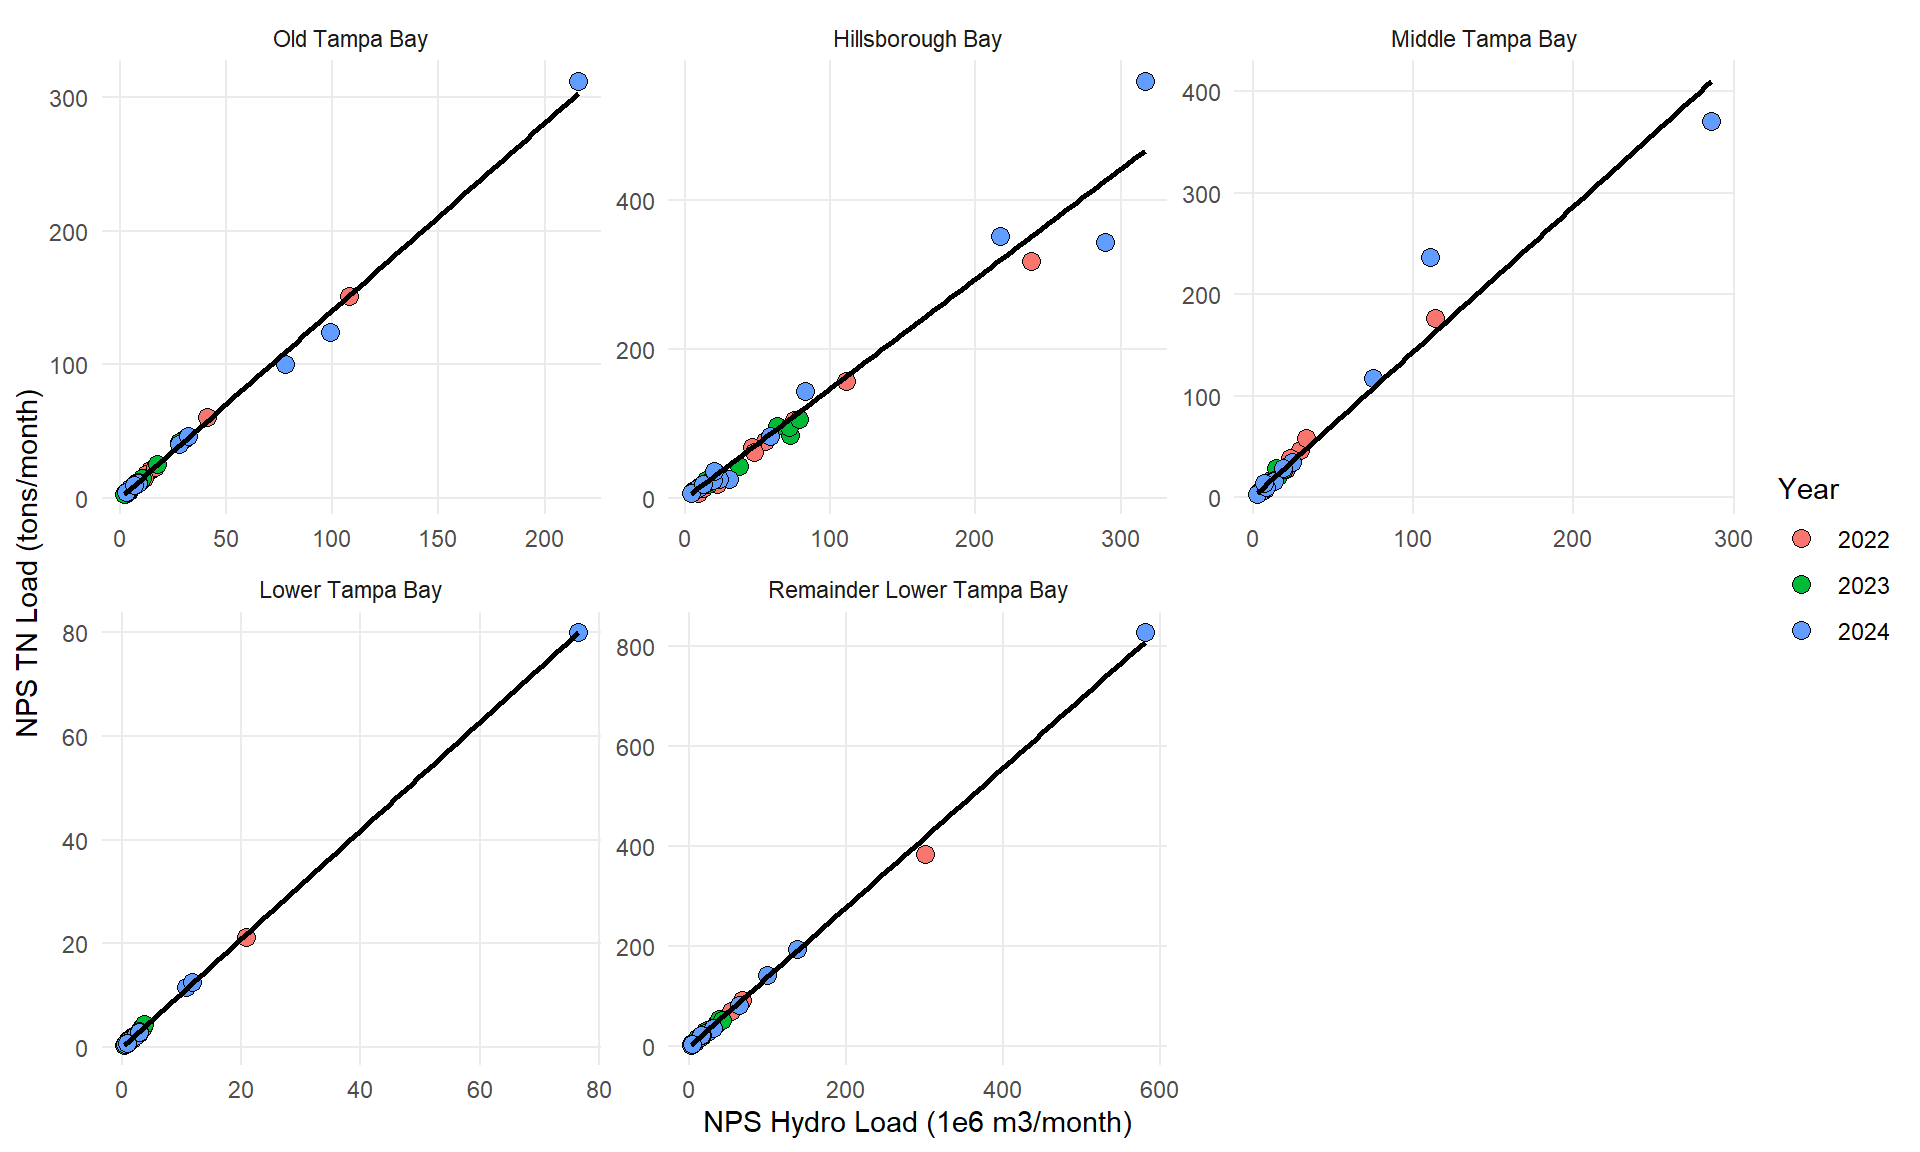
NPS BY MONTH 2022 – 2024
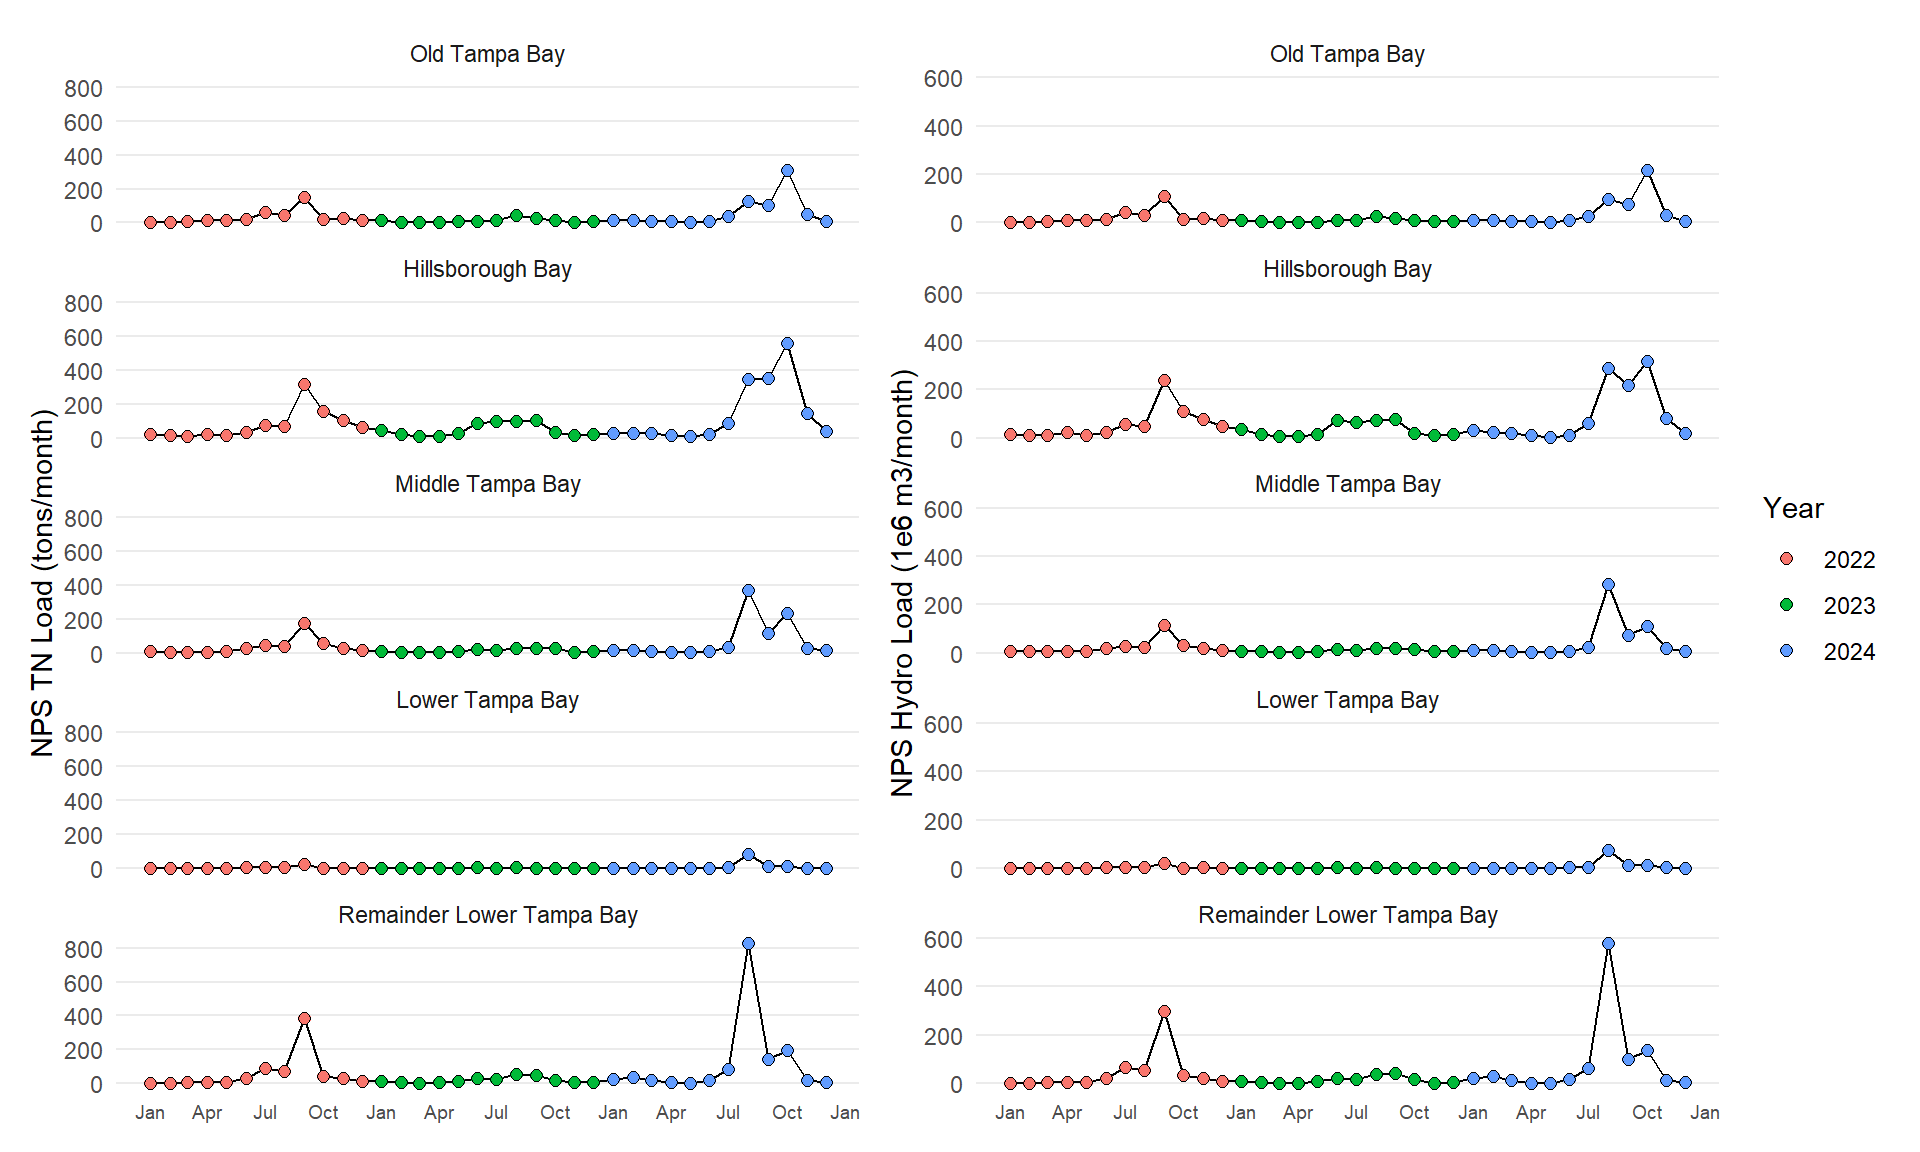
NPS BY MONTH 2022 – 2024