Piney Point trends synthesis
MW Beck
20 September, 2022
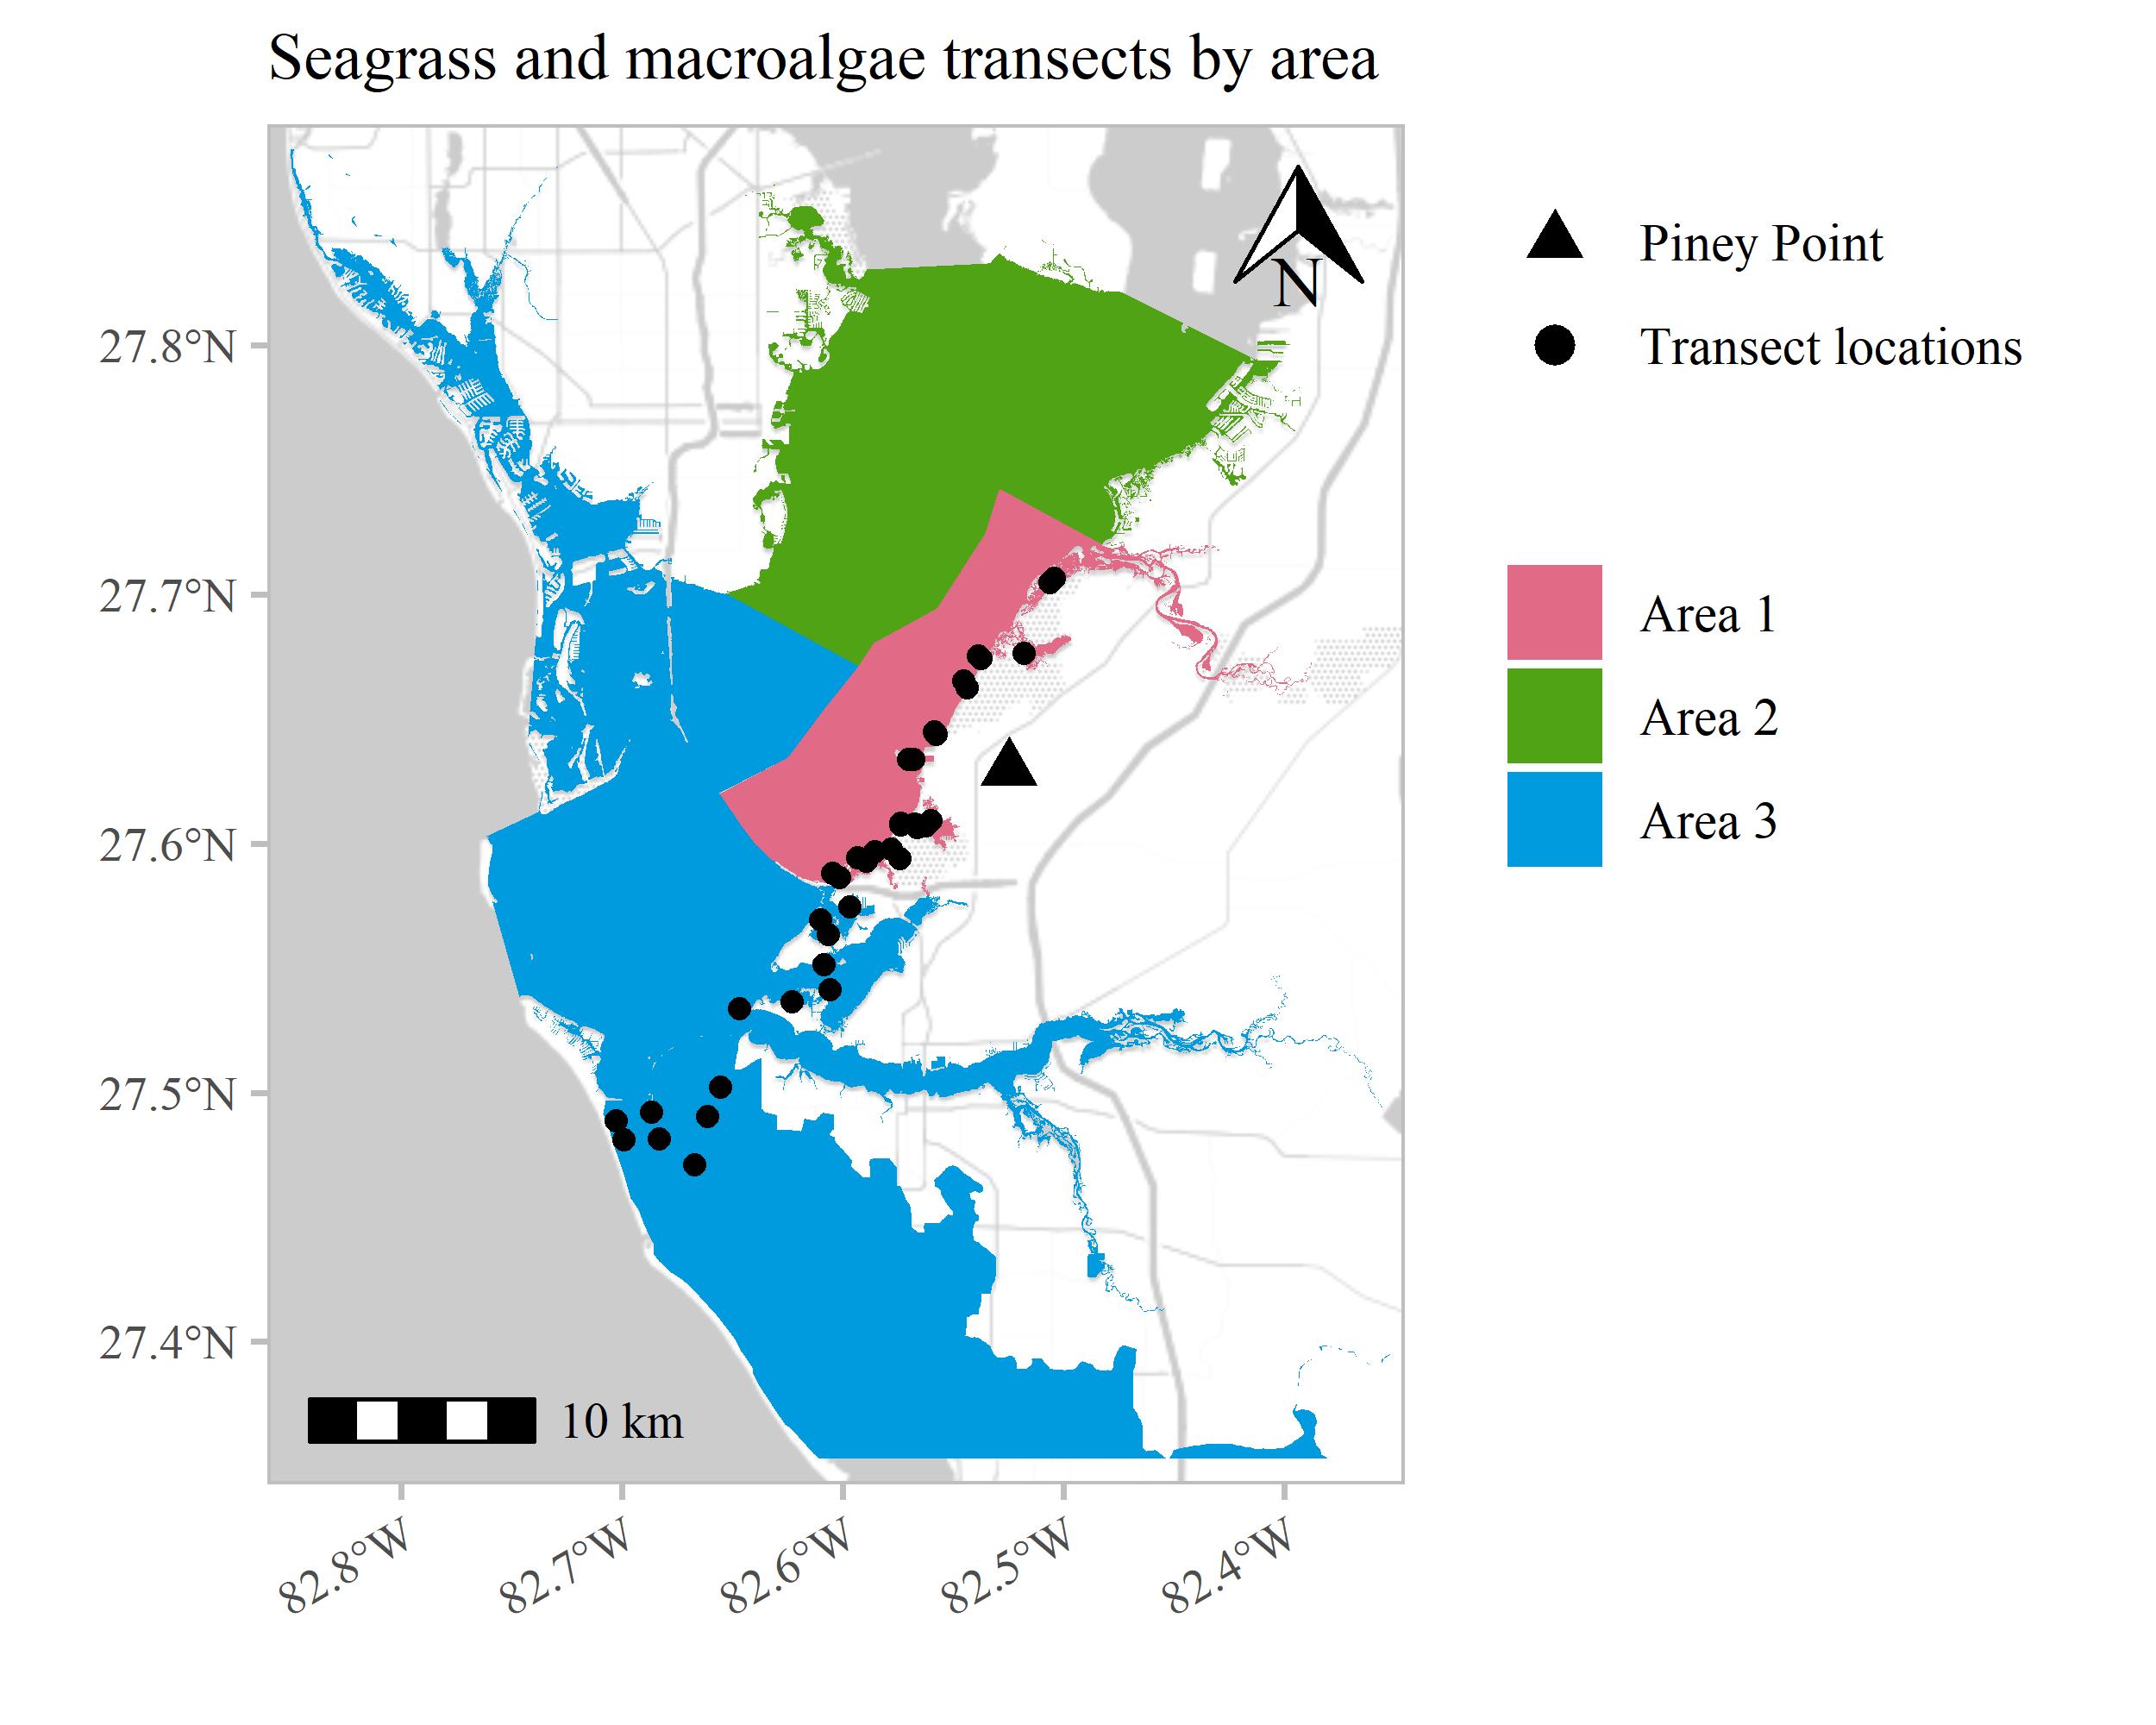
Region delineation


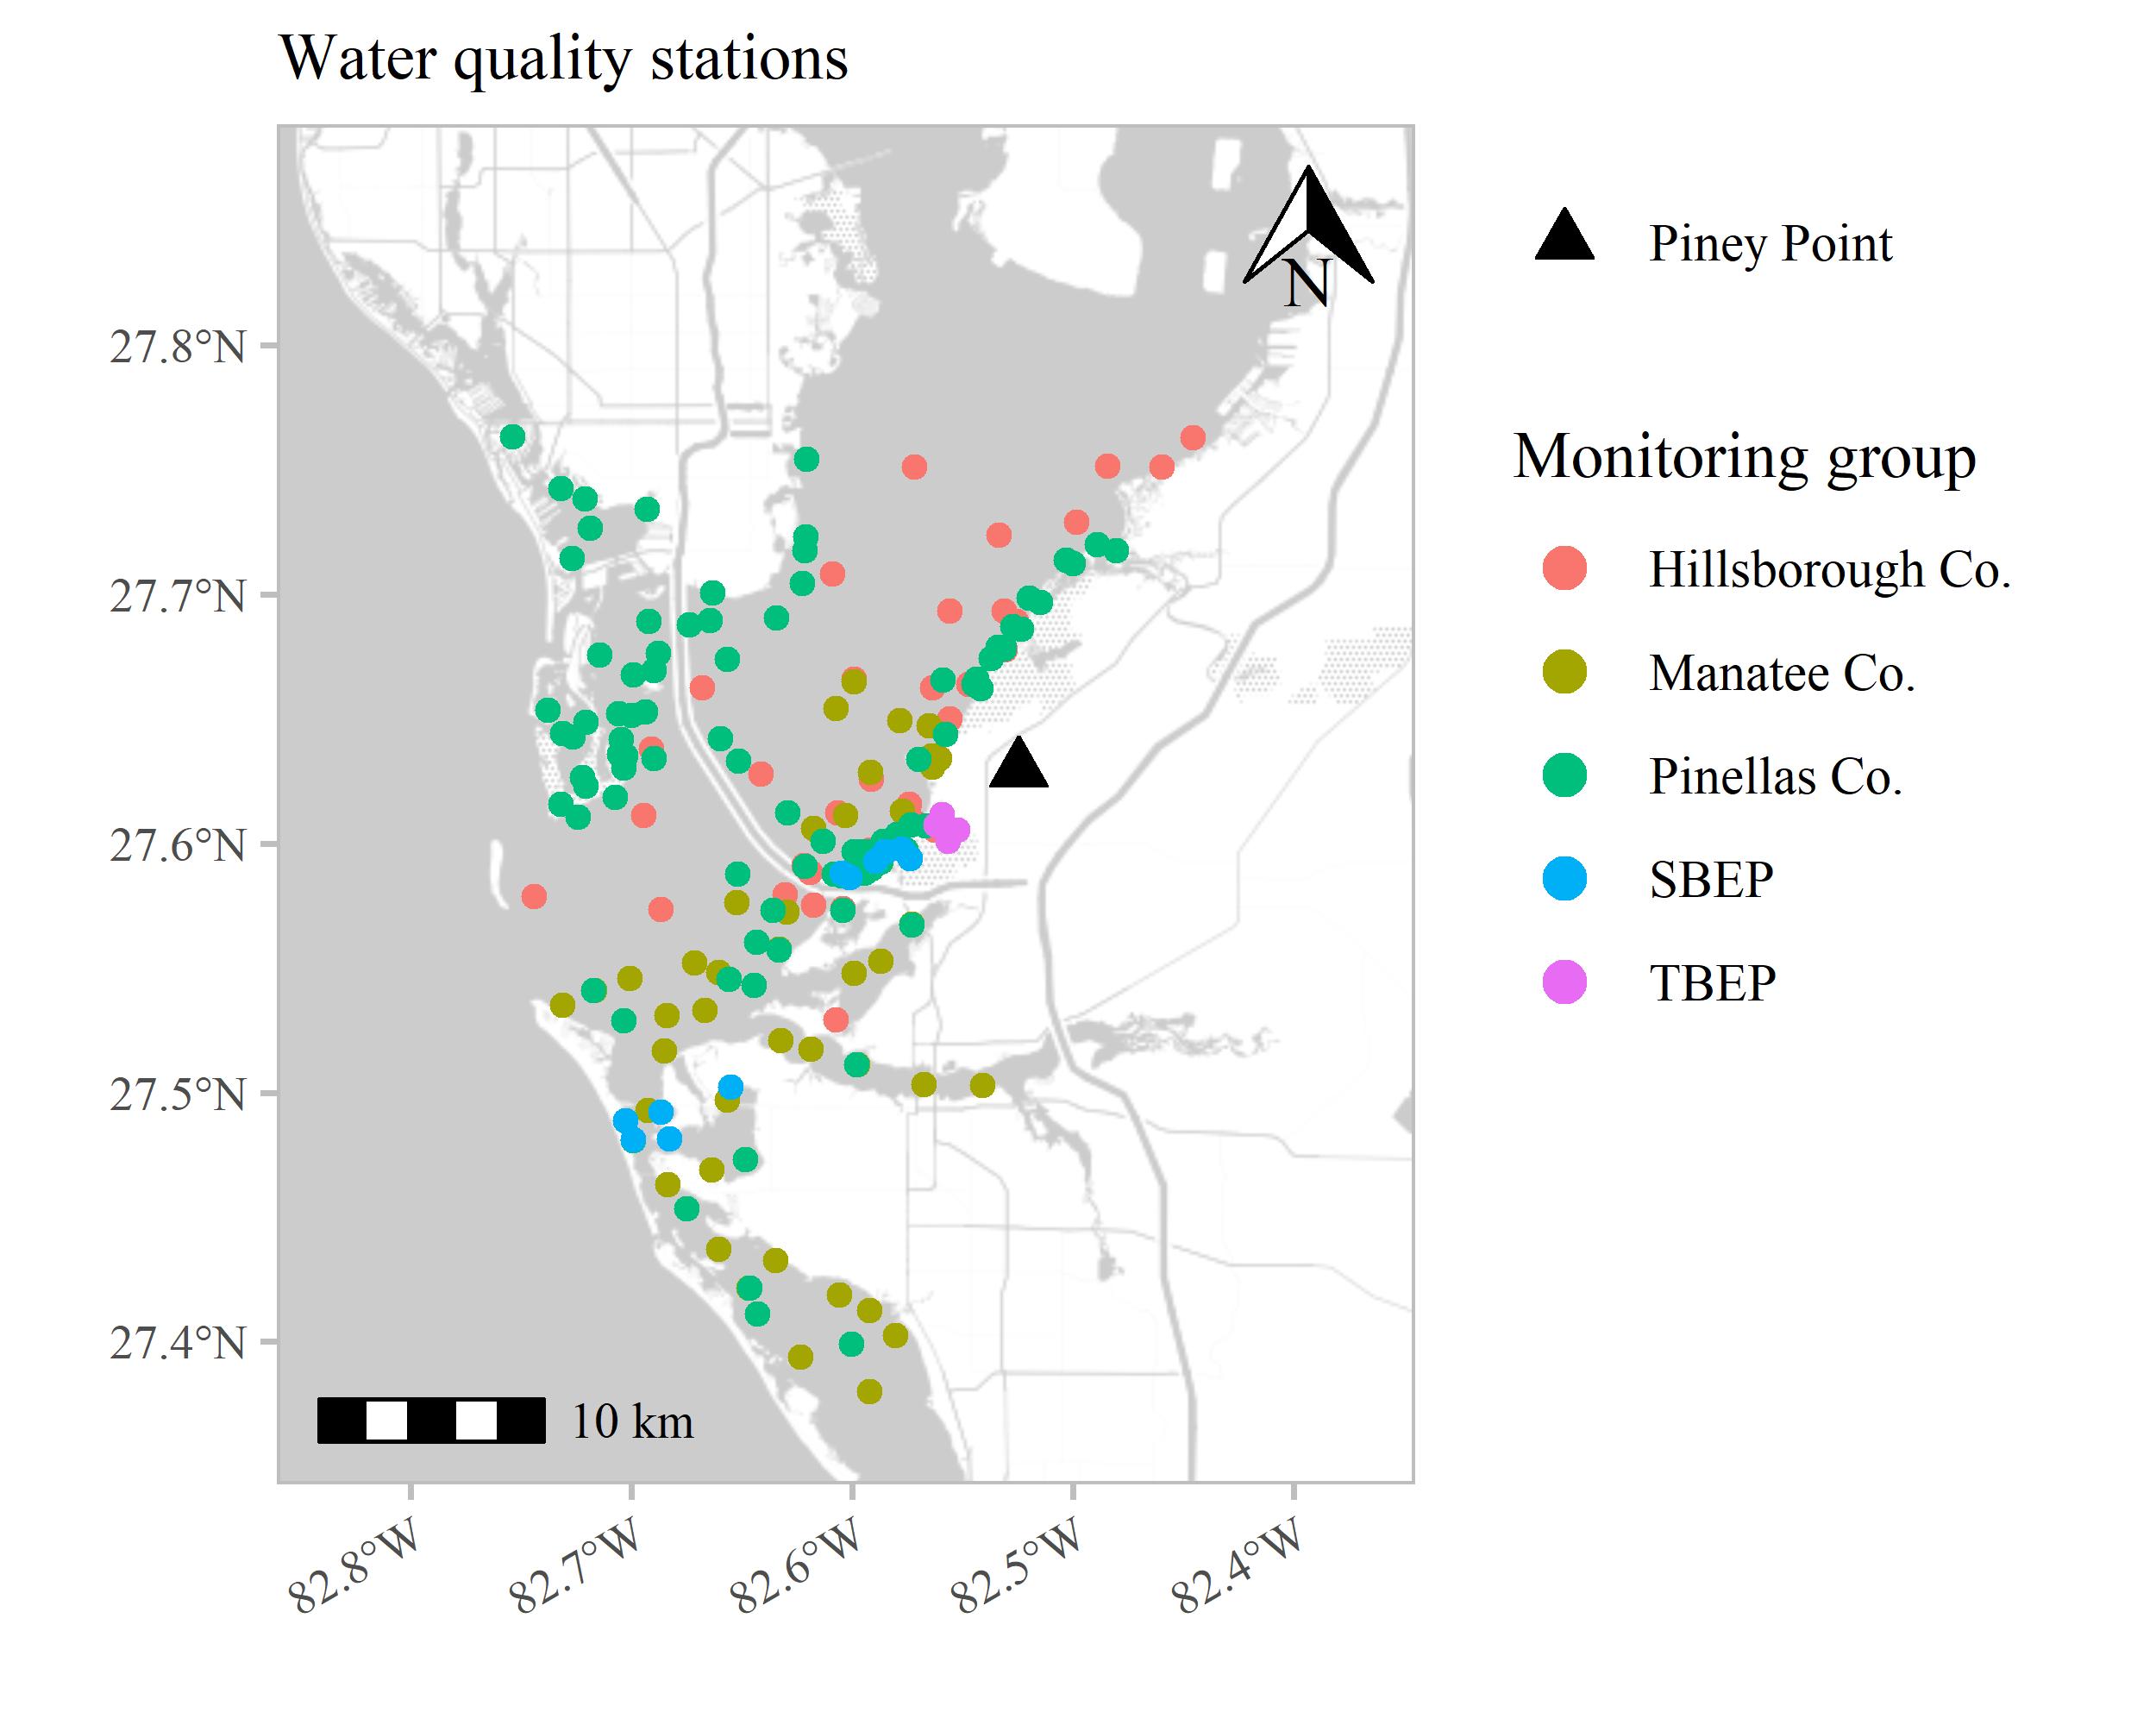
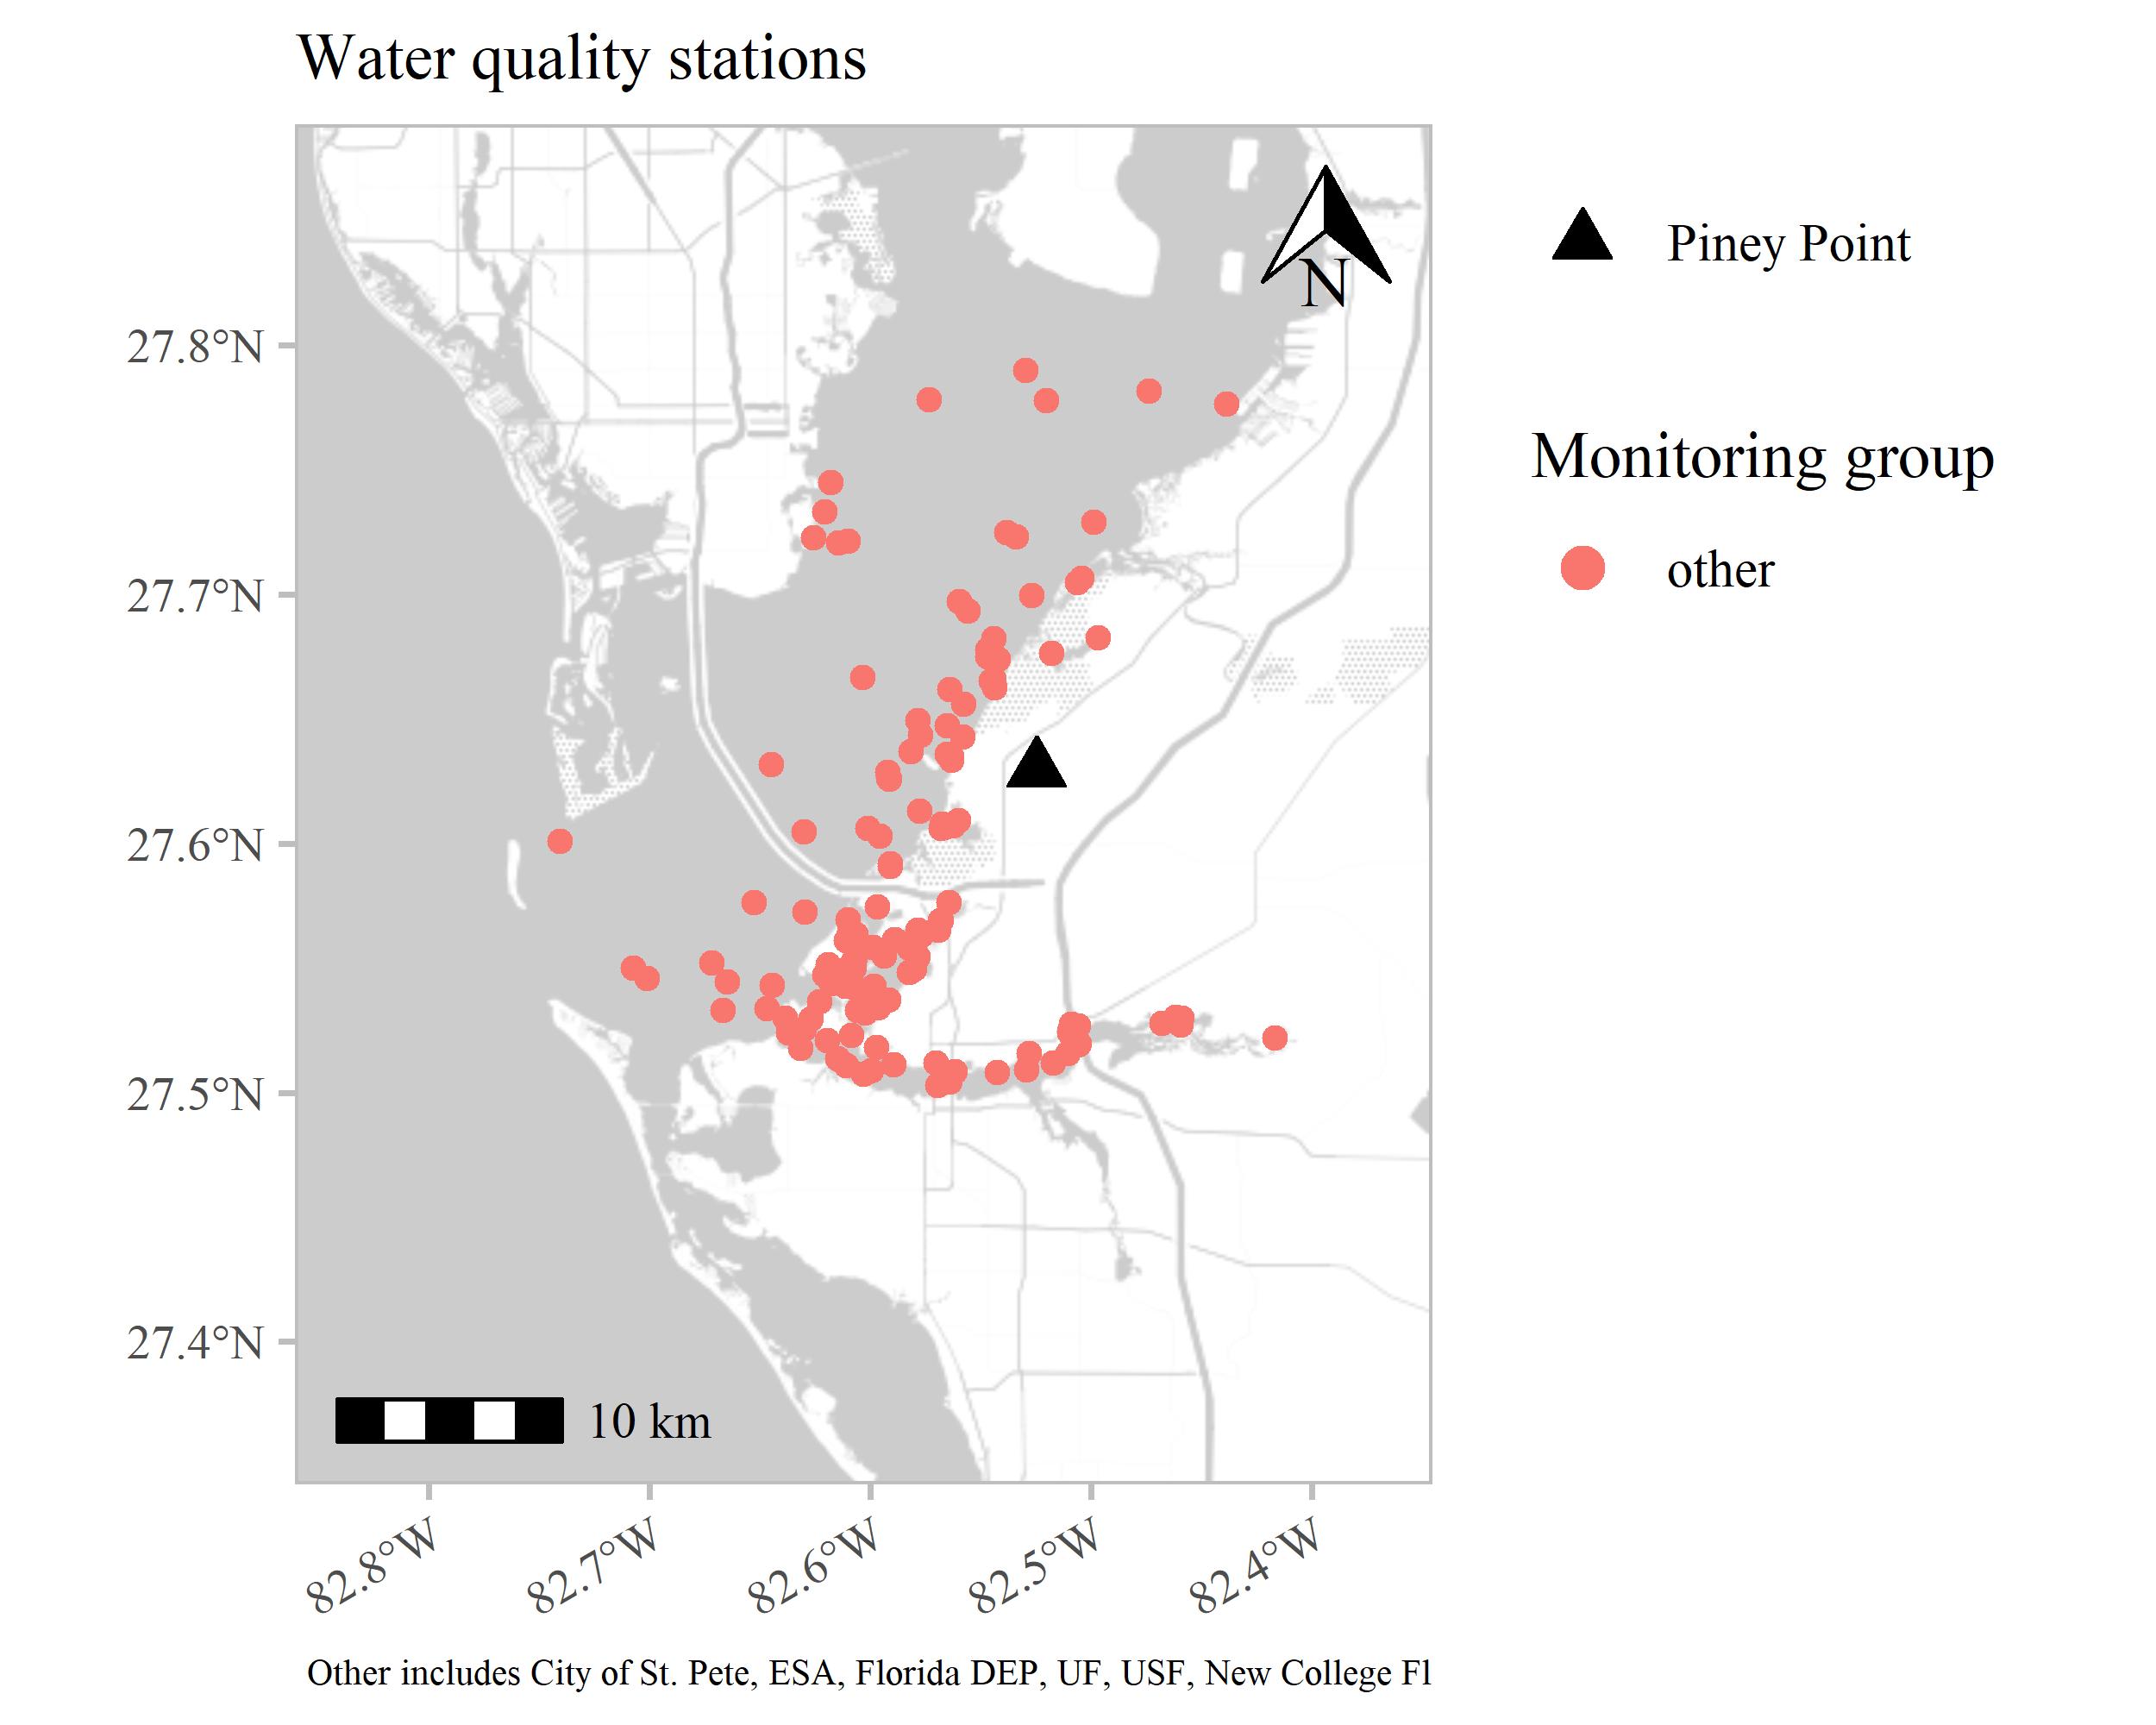
Water Quality
TN

NH3

TP

Chl

DO Sat.

Aug/Sep 2021 v 2022

Phytoplankton
Mixed algae

Centric diatoms

Bacillariophyta

Karenia brevis

Pseudo-nitzschia sp.

Rhizosolenia setigera

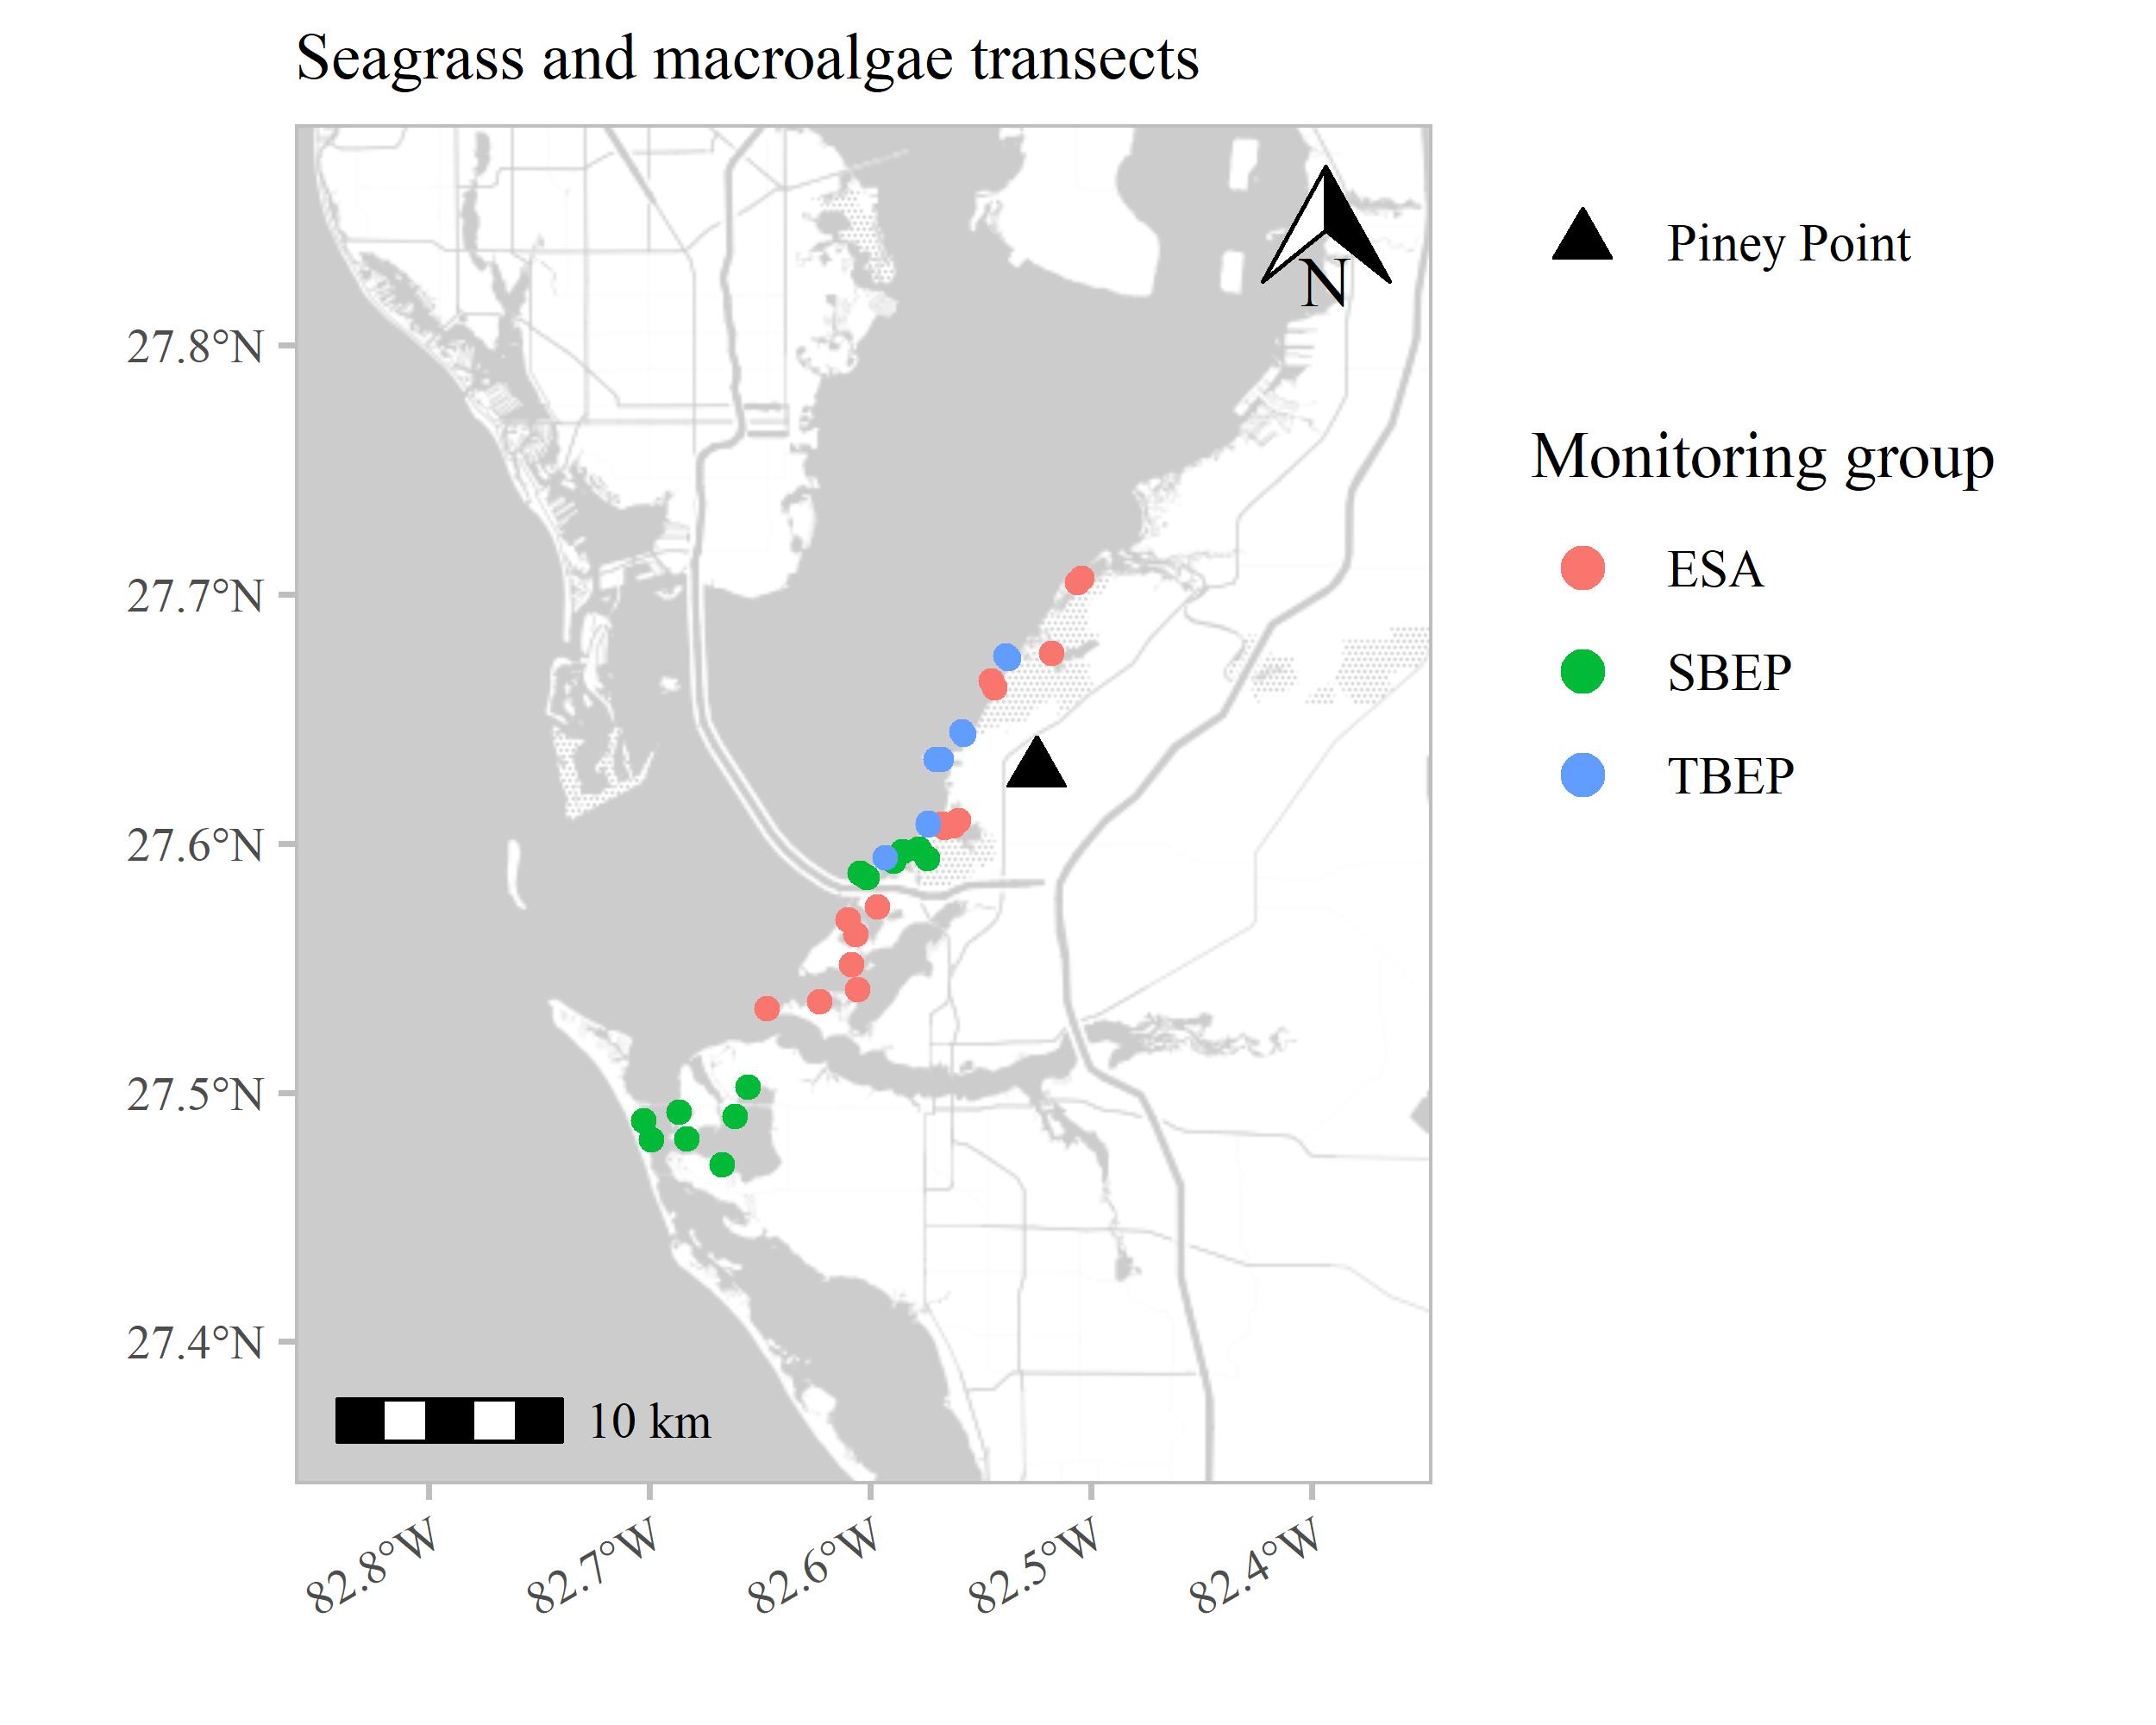
Seagrass
Overall
Note that the “total” category applies if any seagrass or macroalgae were present along a transect and is not the sum of the individual frequency occurrences.

The same plot as above but aggregated across all transects.

Macroalgae only.

SAV vs macroalgae, by station

Water quality vs macroalgae vs SAV

Water quality vs macroalge vs SAV, correlations
This correlation matrix shows correlations between seagrasses, macroalgae, and water quality. Seagrass and macroalgae are correlated at the transect scale, i.e., observations are compared at the same location over time. The water quality comparisons to the other variables are at an aggregated spatial scale because of different sample locations for the transects and water quality.

Biomass estimates
Simple regressions of weight vs abundance by major macroalgae group. Regressions are fit through the origin so that zero weight is fixed at zero mass.

Using the regression, a weight was assigned to all macroalgae samples where abundance (bb) was recorded. The weights were then summed across all quadrats by transect, macroalgae group, month, and region (here) to represent total sampled biomass. However, this is biased by relative sample effort (Area 1 has been sampled ~3x more than Area 3). Below, the weights are standardized to unit effort.

Because of different sampling effort by month and location, weights were standardized by dividing by sample effort (number of unique transect visits in a month). This can also be considered as kg / 1.25 m2 because five quadrats of 0.25 m2 are surveyed each transect. So converting this to kg / m2, the weights are multiplied by 0.8 (1 / 1.25).

August 2021 v 2022
