This vignette provides two figures that support the 2025 update of sea level rise projections for the Tampa Bay region. The report [1] was created by the Climate Science Advisory Panel (CSAP) to update recommendations from the previous report [2].
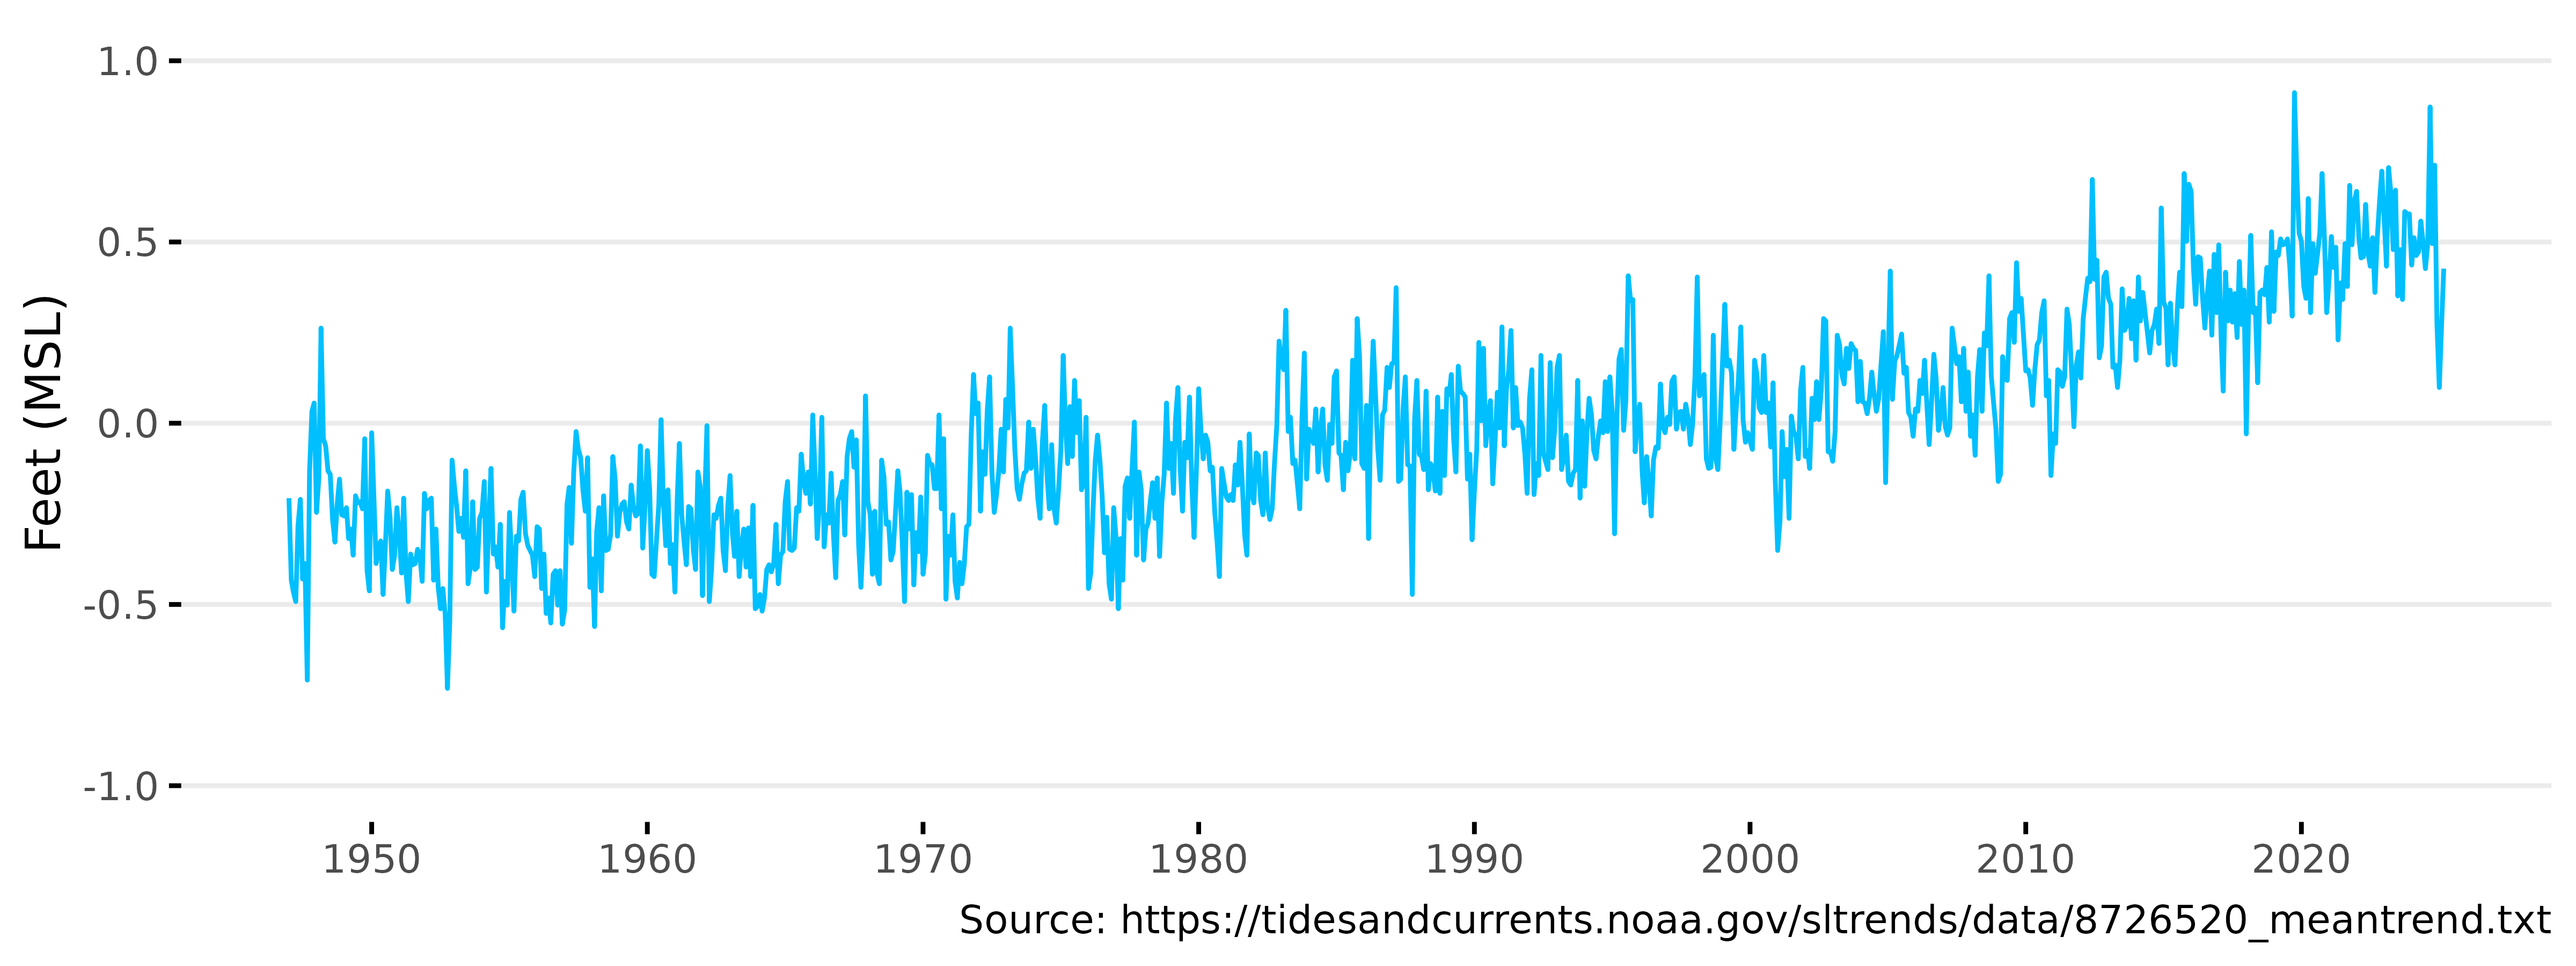
The first figure shows mean monthly sea level at the St. Petersburg, FL tide gauge, with the seasonal cycle removed. Download the figure here.

1947-2025 monthly mean sea level (MSL) in St. Petersburg, FL, NOAA tide gauge 8726520. Seasonal cycle removed.
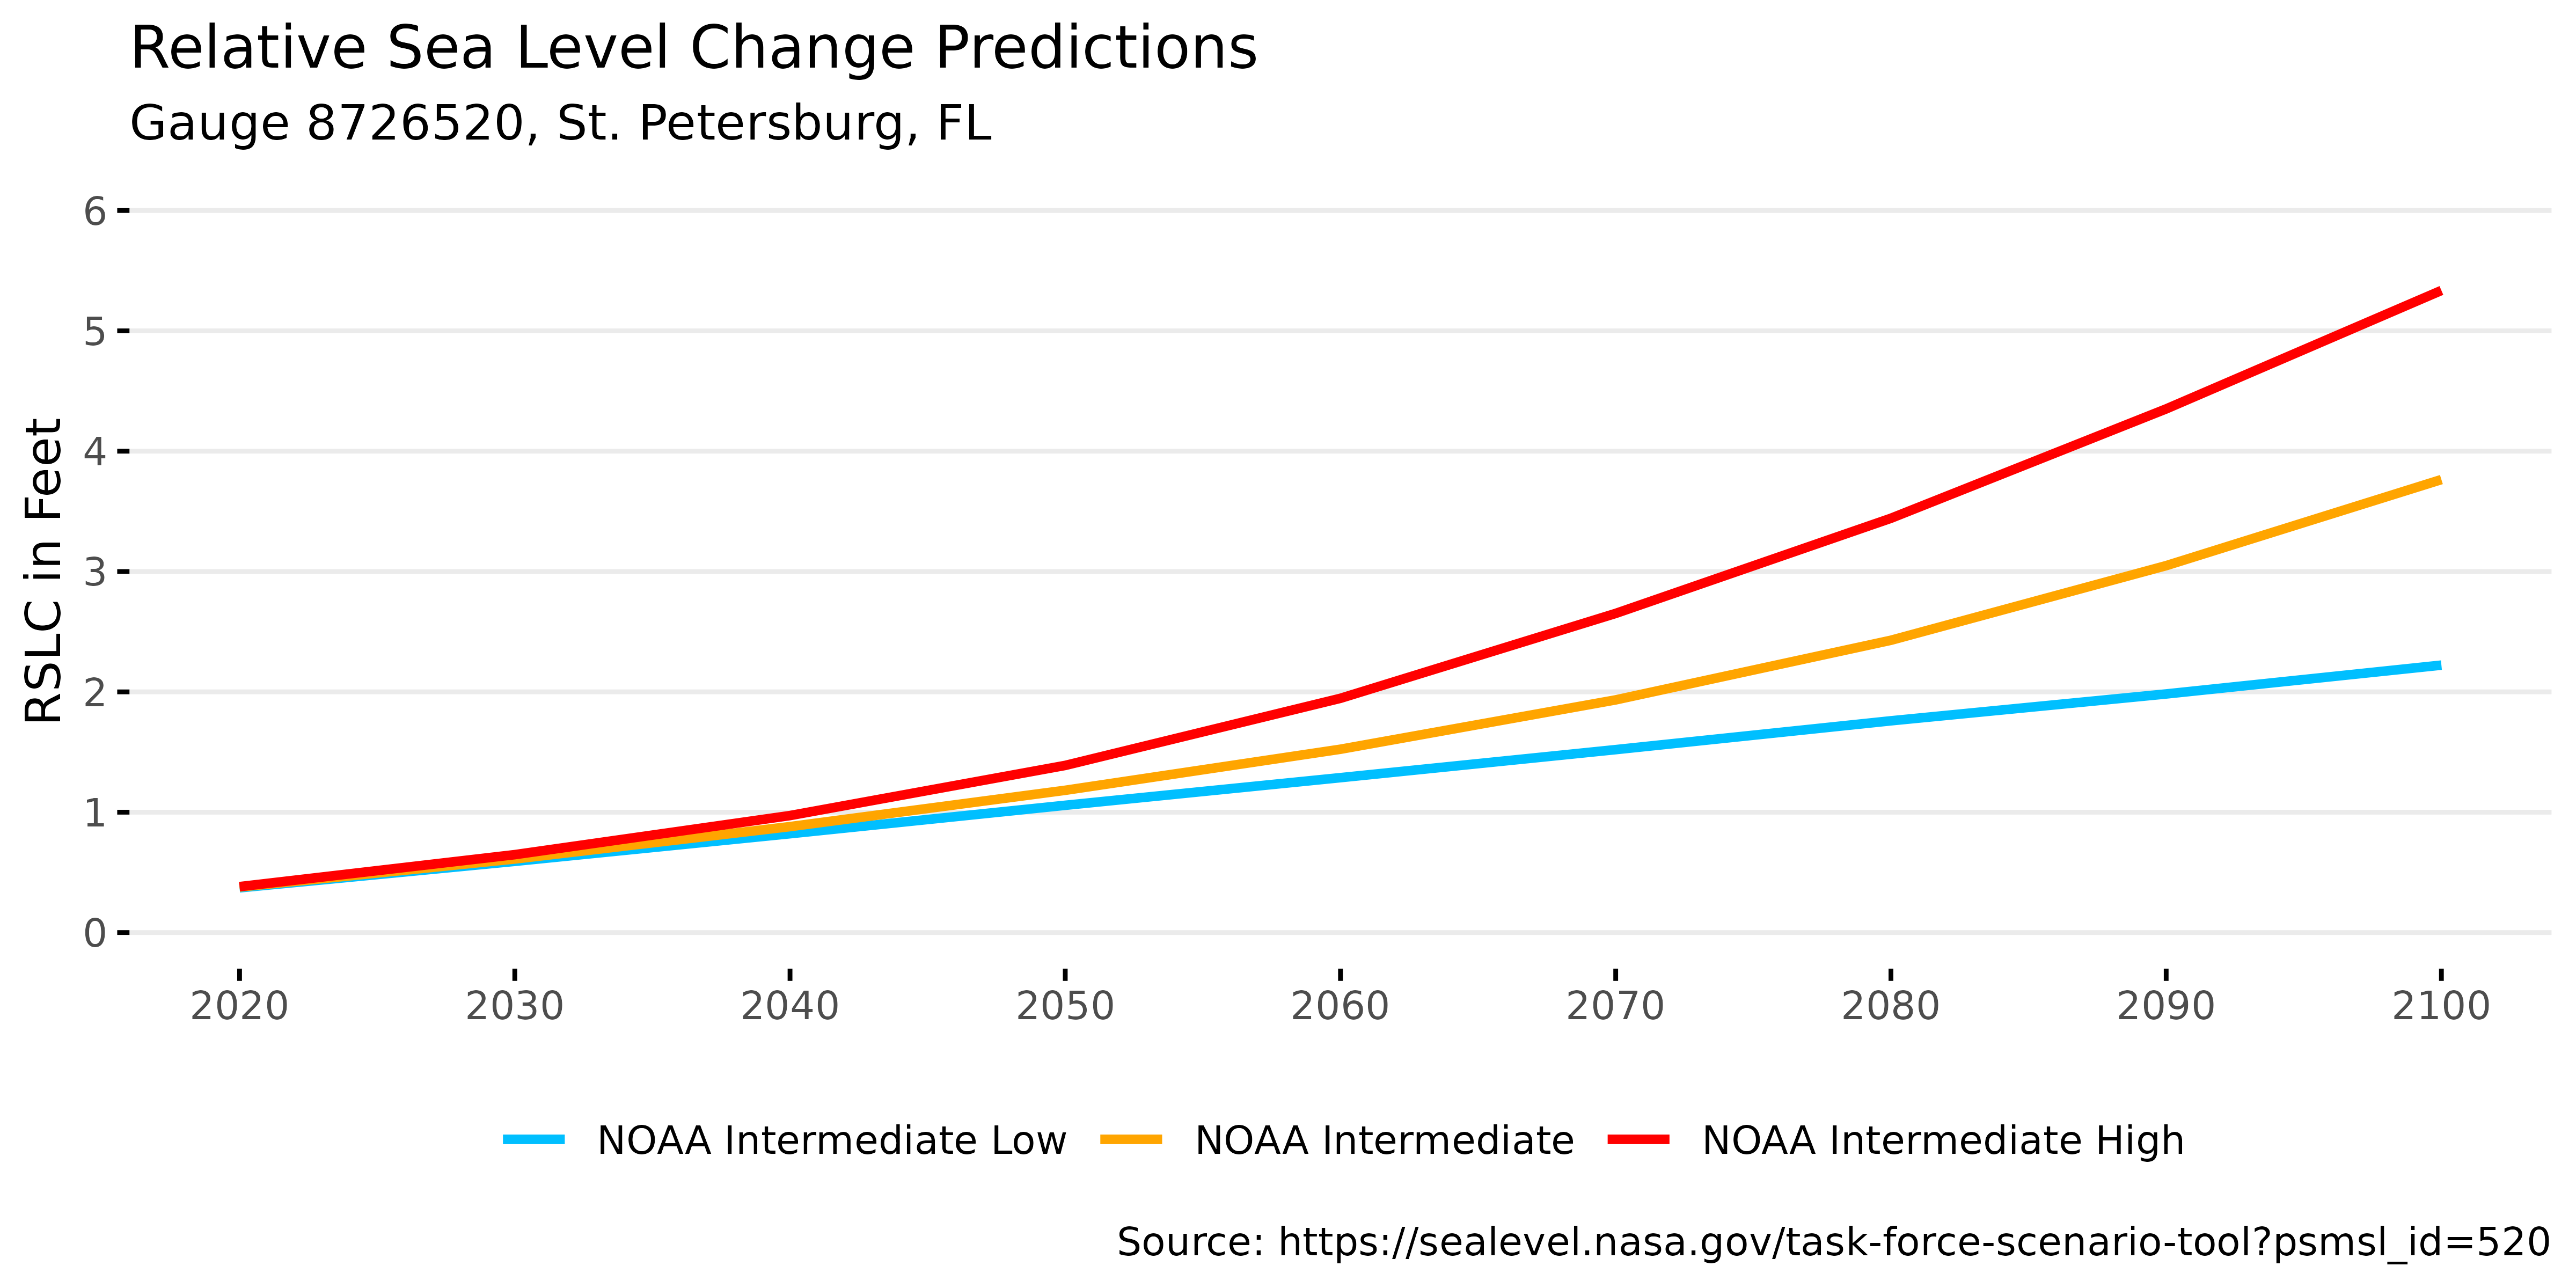
The second figure shows three recommended sea level rise scenarios for St. Petersburg, FL based on regionally corrected NOAA 2022 curves. Download the figure here.

Graphic relative sea level change (RSLC) scenarios for St. Petersburg, FL, as calculated using the regionally corrected NOAA 2022 curves.