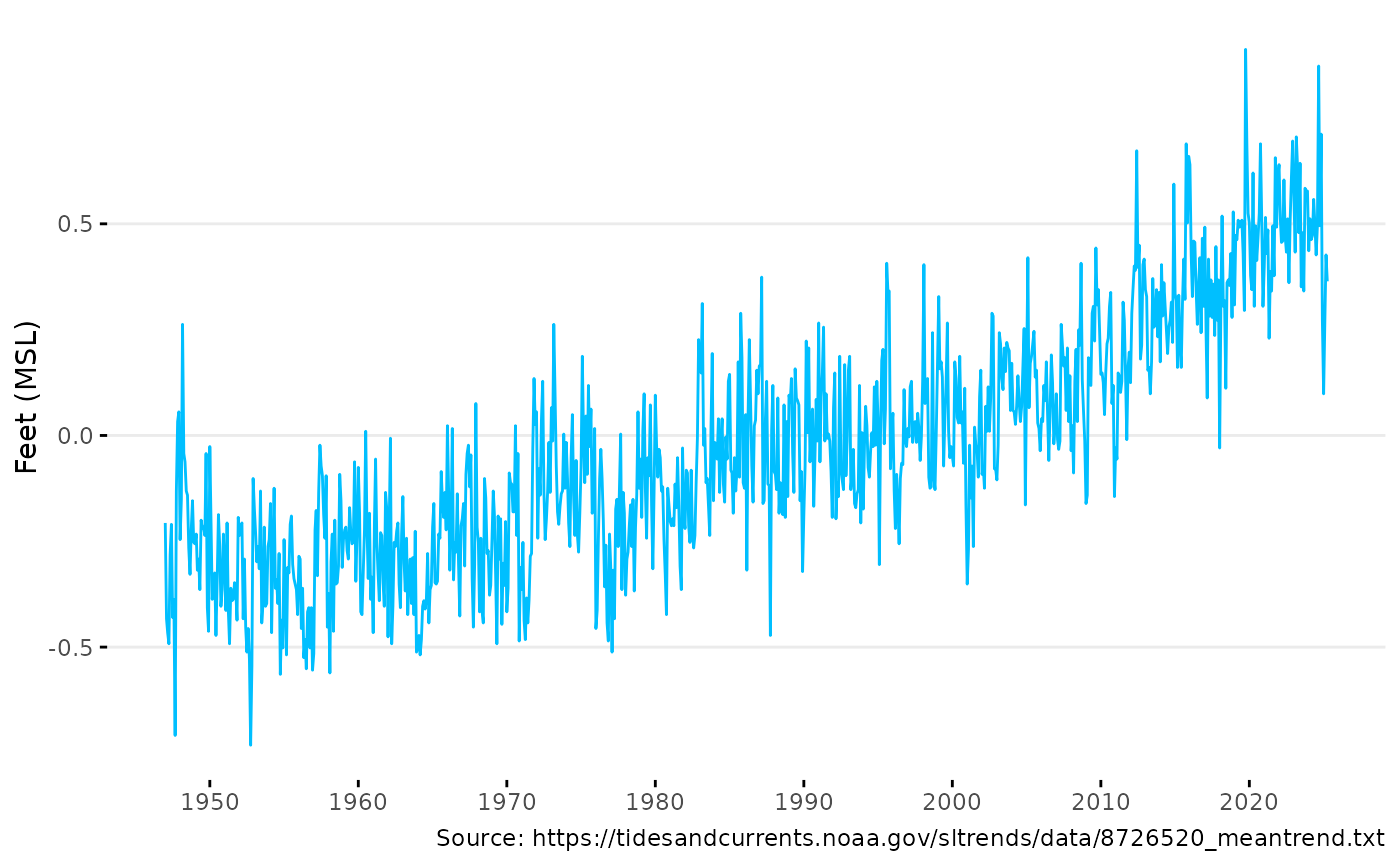
Plot sea level data
Usage
plot_sealevel(
  dat,
  col = "deepskyblue",
  units = "ft",
  caption = TRUE,
  xrng = NULL,
  xbrk = 10,
  yrng = NULL,
  ybrk = 5,
  plotly = FALSE
)
Arguments
- dat
Input data from
get_sealevel().- col
character, color for the line. Default is
'deepskyblue'.- units
character, units for the y-axis. Default is
'ft'. Options are'ft'and'm'.- caption
logical, add caption with source. Default is
TRUE. Does not apply ifplotly = TRUE.- xrng
Date, x-axis range as two values. Default is
NULL, which uses the range of the data.- xbrk
numeric, number of x-axis breaks. Default is
10. Does not apply ifplotly = TRUE.- yrng
numeric, y-axis range as two values. Default is
NULL, which uses the range of the data.- ybrk
numeric, number of y-axis breaks. Default is
5. Does not apply ifplotly = TRUE.- plotly
logical, if
TRUE, returns a plotly object instead of ggplot. Default isFALSE.
Examples
dat <- get_sealevel()
plot_sealevel(dat)