Pathogens
Get the lesson R script: pathogens.R
Get the lesson data: download zip
Lesson Outline
Goals and motivation
This module will provide you with background on how to use the peptools R package to import, summarize, and plot beach pathogen data. You should be able to answer these questions at the end of this session:
- How can I use the peptools package to import pathogen data?
- How does the peptools package summarize pathogen data for reporting?
- What functions are available for summarizing pathogen data?
- What functions are available for plotting pathogen data?
Background
Regular monitoring of swimming beach pathogens is conducted by Suffolk County Department of Health Services (SCDHS). As noted on the Suffolk County website (https://www.suffolkcountyny.gov/Departments/Health-Services/Environmental-Quality/Ecology/Beach-Monitoring-Program), water quality at swimming beaches can be adversely affected by episodic sources such as stormwater runoff, wastewater discharges from boats or land-based septic systems, and fecal material from pets and wildlife. To provide information on the potential presence of pathogens public in swimming areas that may be impacted by such contamination, the Suffolk County Department of Health Services (SCDHS) conducts a comprehensive bathing beach water quality monitoring program from May through September each year. Sampling is performed by SCDHS staff, with analyses conducted by the Department’s accredited Public and Environmental Health Laboratory (PEHL). Data are available here.
Information from this monitoring program can be summarized in graphical form, to communicate the relative risk of exposure to pathogens at bathing beaches in the Peconic Estuary. Functions in the peptools package can be used to import the pathogen data provided by SCHDS and PEHL, analyze relative exceedances of pathogen criterion, and plot the results in an easily interpretable format. This training module describes use of these functions.
Data import and processing
The pathogen data can be imported using the read_pepent() function. A compressed folder that includes the data can be downloaded from here. After the data are downloaded and extracted, the Excel file with the raw data is named “QryEnteros 2010 - 2019.xlsx”, or something similar depending on when the data were downloaded. The location of this file on your computer is passed to the import function. Below, a local file on your computer renamed as “enterodata.xlsx” that contains the pathogen data is imported.
entdat <- read_pepent('data/enterodata.xlsx')
head(entdat)
## # A tibble: 6 x 5
## Name FieldNum Date value status
## <chr> <chr> <dttm> <dbl> <chr>
## 1 Alberts Landing Beach EH7 2010-06-29 09:47:00 4 "<"
## 2 Alberts Landing Beach EH7 2010-07-27 09:49:00 4 "<"
## 3 Alberts Landing Beach EH7 2010-08-13 09:18:00 28 ""
## 4 Alberts Landing Beach EH7 2011-06-22 10:21:00 4 "<"
## 5 Alberts Landing Beach EH7 2011-07-20 10:57:00 4 "<"
## 6 Alberts Landing Beach EH7 2011-08-17 11:14:00 4 "<"The raw data includes concentrations of Enterococcus bacteria as cfu/100 mL for swimming beaches in Suffolk County. The imported data returned by read_pepent() has a similar format as the raw data with slight modifications for readability in R. The fields include beach name (Name), field number (FieldNum), collection date and time (Date as Eastern Standard Time), bacteria concentration (value), and status showing if the observation was above or below detection (indicated as > or <).
The function anlz_entpep() summarizes the imported data at each beach to quantify instances when bacterial concentrations may be at risk of impacting human health. For Suffolk County, all bathing beaches are ranked by relative risk of exposure to harmful bacteria. Factors considered in the ranking include pollution threats (outfalls, discharges, runoff, marinas, etc.), beach location, historical monitoring data, and beach use. Most beaches in the Peconic Estuary are Tier 2 or 3, with at most 1-2 samples for bacterial concentrations collected weekly. For the peptools package, the Enterococcus data were used to count the number of instances at each beach when concentrations were above 104 cfu/ml. Although this does not mean a beach was closed, relative exceedances provide a coarse measure of potential risk of exposure to harmful pathogens.
The anlz_entpep() function estimates this exposure risk by counting the number of instances in a year when concentrations at a beach exceeded the threshold for each 24 hour period in the dataset. The results show samples for number of days sampled each year, number of exceedances for the samples, and proexceedances as the proportion of samples with exceedances. Only the 28 relevant beaches for the Peconic Estuary are returned.
anlz_entpep(entdat)## # A tibble: 308 x 5
## Name yr samples exceedances proexceedances
## * <chr> <dbl> <int> <int> <dbl>
## 1 Alberts Landing Beach 2010 3 0 0
## 2 Alberts Landing Beach 2011 3 0 0
## 3 Alberts Landing Beach 2012 4 0 0
## 4 Alberts Landing Beach 2013 3 0 0
## 5 Alberts Landing Beach 2014 4 0 0
## 6 Alberts Landing Beach 2015 3 0 0
## 7 Alberts Landing Beach 2016 5 0 0
## 8 Alberts Landing Beach 2017 3 0 0
## 9 Alberts Landing Beach 2018 6 1 0.167
## 10 Alberts Landing Beach 2019 3 0 0
## # ... with 298 more rowsThe anlz_entpep() function includes an optional arguments for the threshold (thr). The default values are 104 cfu/100 mL, which can easily be changed. Here we use a threshold of 50 cfu/100 mL.
anlz_entpep(entdat, thr = 50)## # A tibble: 308 x 5
## Name yr samples exceedances proexceedances
## * <chr> <dbl> <int> <int> <dbl>
## 1 Alberts Landing Beach 2010 3 0 0
## 2 Alberts Landing Beach 2011 3 0 0
## 3 Alberts Landing Beach 2012 4 0 0
## 4 Alberts Landing Beach 2013 3 0 0
## 5 Alberts Landing Beach 2014 4 0 0
## 6 Alberts Landing Beach 2015 3 0 0
## 7 Alberts Landing Beach 2016 5 0 0
## 8 Alberts Landing Beach 2017 3 0 0
## 9 Alberts Landing Beach 2018 6 1 0.167
## 10 Alberts Landing Beach 2019 3 0 0
## # ... with 298 more rowsPlotting results
A summary graphic can be plotted using the show_entmatrix() function. This creates an annual reporting matrix for the relative risk of pathogen exposure at 28 selected beaches in the Peconic Estuary. Tracking the number of exceedances of bacterial concentrations provides a framework for identifying locations that may need management actions to remediate potential public health issues.
show_entmatrix(entdat)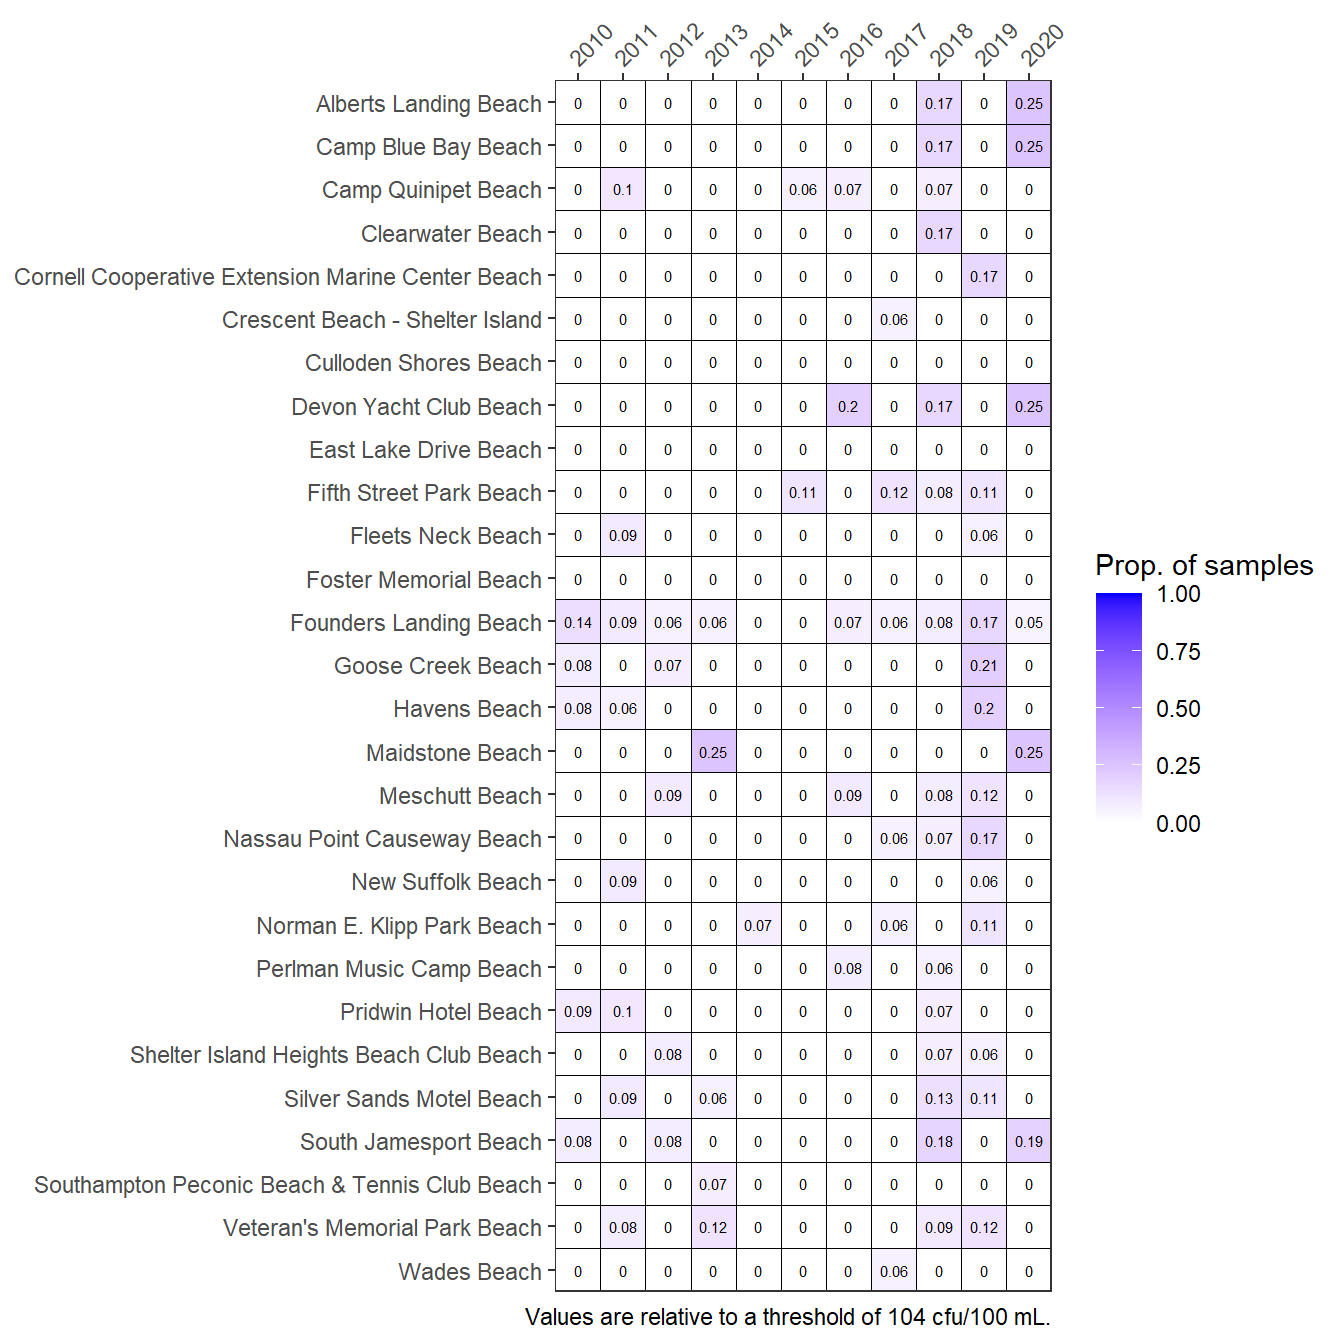
Frequencies of exceedances of Enterococcus concentrations at Peconic Estuary bathing beaches for the years 2010 through 2020. Values are proportion of samples exceeding.
The graphic can also show the number of exceedances as counts by changing the show argument.
show_entmatrix(entdat, show = 'exceedances')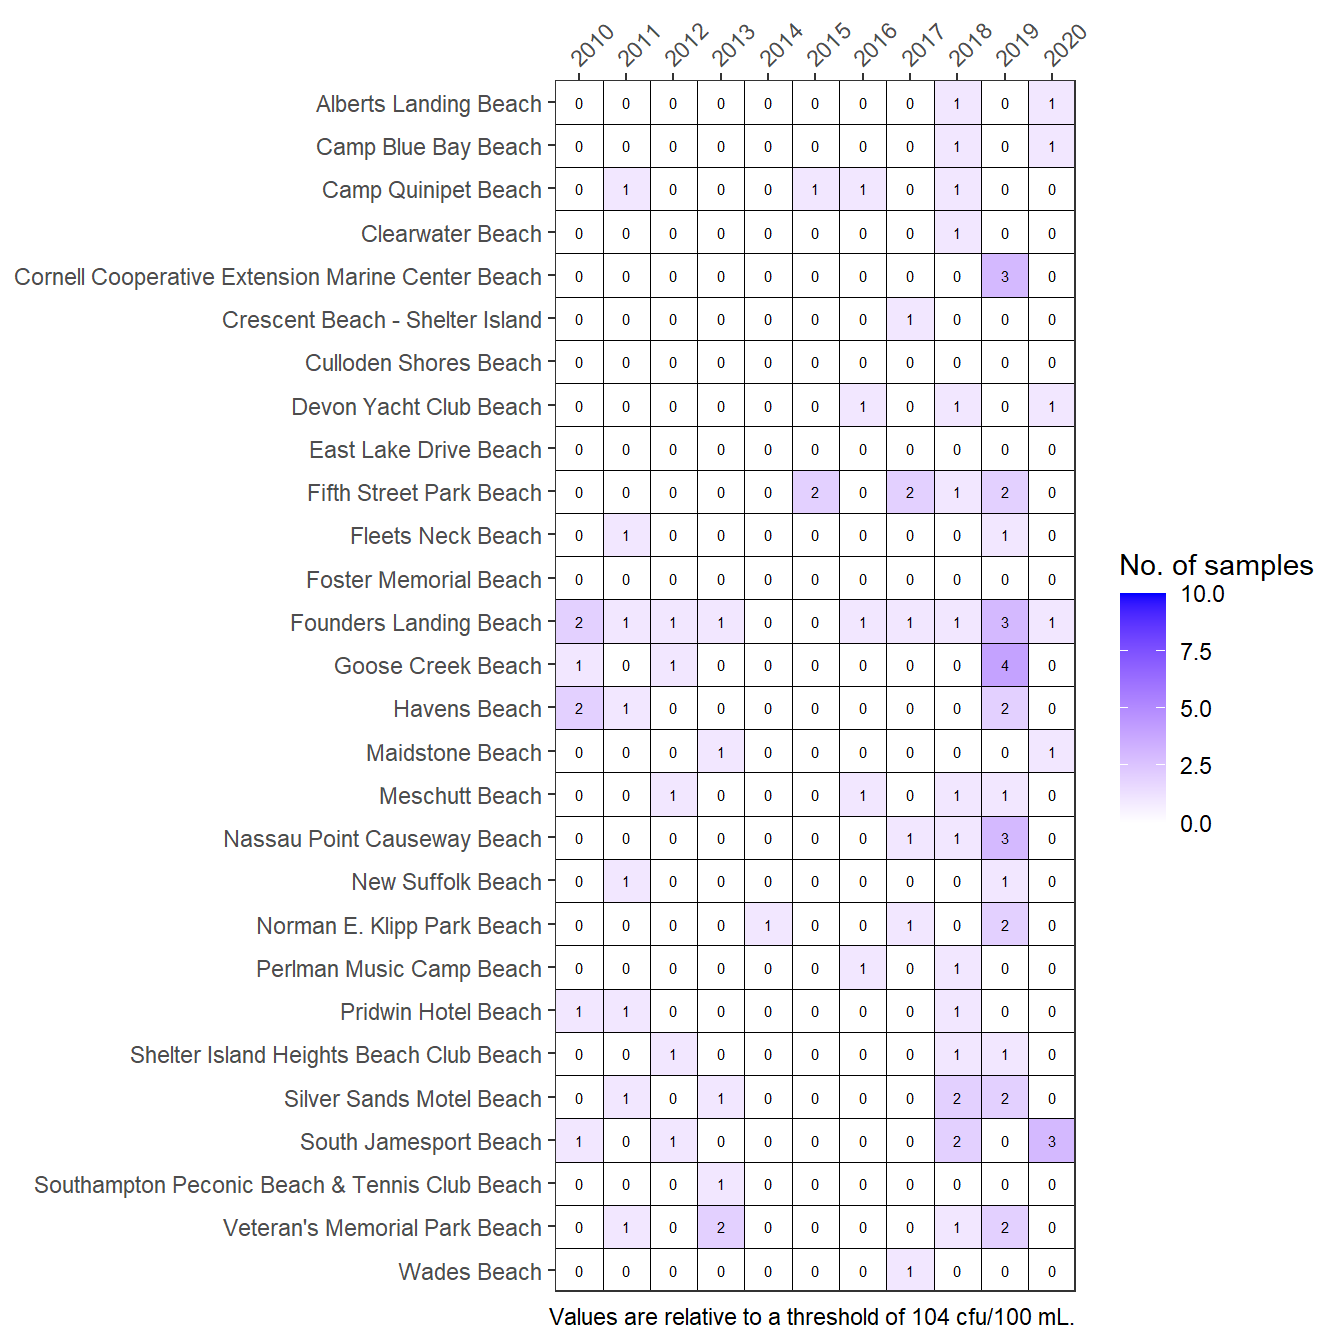
Frequencies of exceedances of Enterococcus concentrations at Peconic Estuary bathing beaches for the years 2010 through 2020. Values are number of samples exceeding.
The anlz_entpep() function is used internally in show_entmatrix(), such that the optional argument for the threshold (thr) also applies in the plotting function. Appropriate thresholds should be identified. Potential alternatives can be viewed by using a different value for the thr argument.
show_entmatrix(entdat, thr = 35)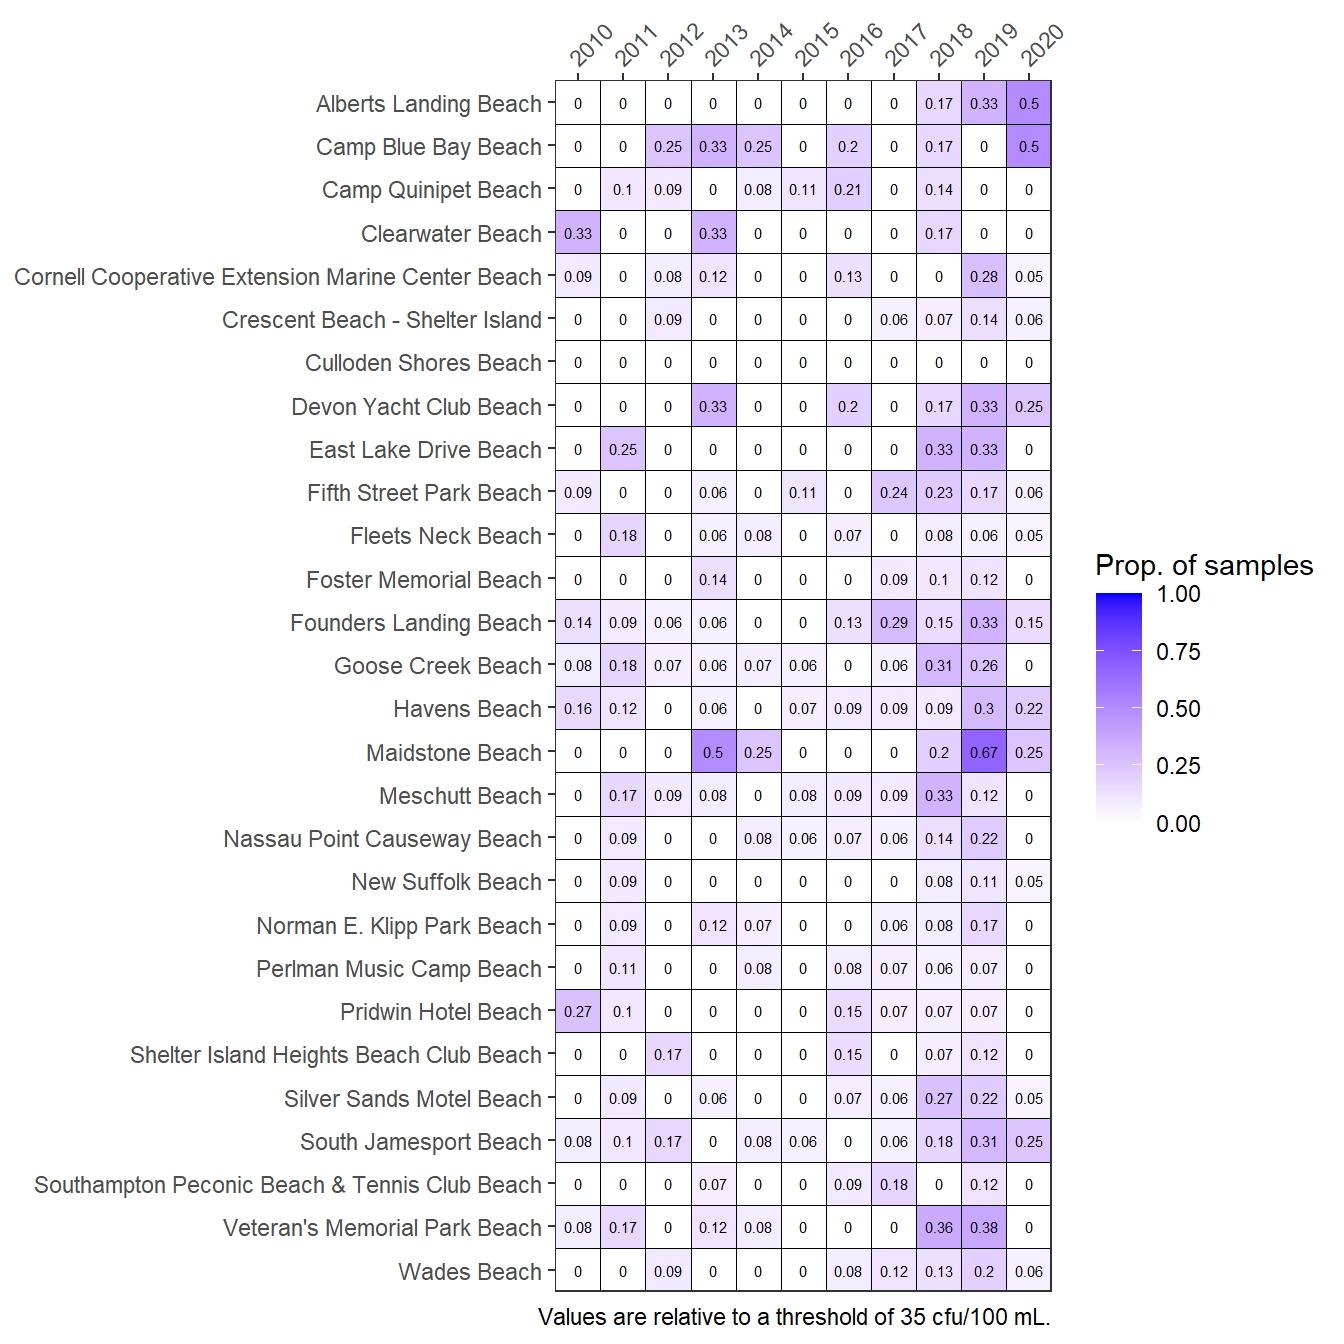
Frequencies of exceedances of Enterococcus concentrations at Peconic Estuary bathing beaches for the years 2010 through 2020. A different option is used for the threshold argument.