Plot annual water quality value and thresholds for all segments
show_allthrpep.RdPlot annual water quality values and thresholds for all bay segments
Usage
show_allthrpep(
  dat,
  param = c("chla", "sd", "tn"),
  trgs = NULL,
  yrrng = NULL,
  family = NA,
  labelexp = TRUE,
  txtlab = TRUE
)
Arguments
- dat
data frame of data returned by
read_pepwq- param
chr string indicating which water quality value and appropriate threshold to plot, one of "chla" for chlorophyll, "sd" for secchi depth, or "tn" for total nitrogen
- trgs
optional
data.framefor annual bay segment water quality thresholds, defaults topeptargets- yrrng
numeric vector indicating min, max years to include
- family
optional chr string indicating font family for text labels
- labelexp
logical indicating if y axis and target labels are plotted as expressions, default
TRUE- txtlab
logical indicating if a text label for the target value is shown in the plot
Value
A ggplot object
Details
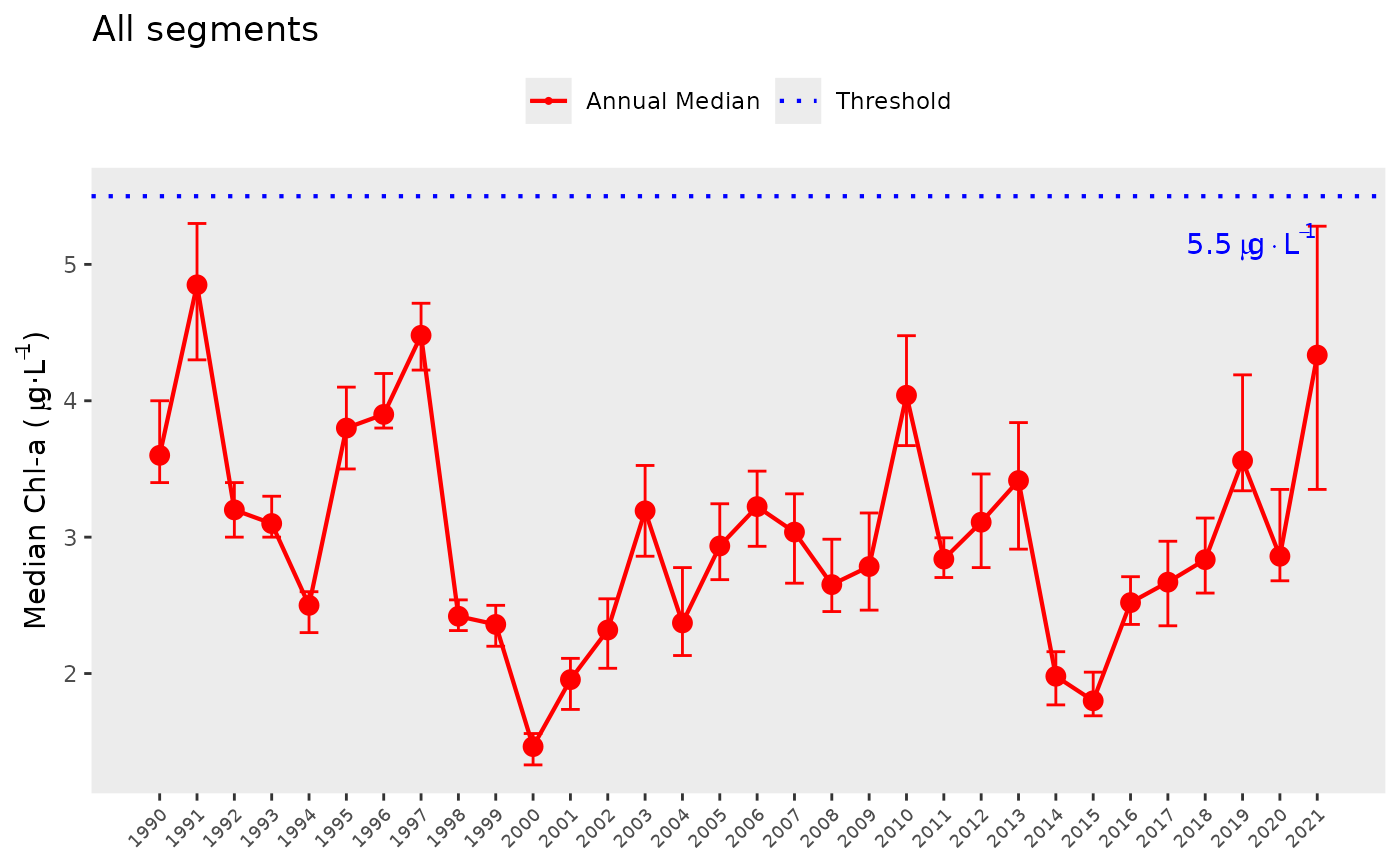
This function is conceptually similar to show_thrpep, but results are shown as annual medians across all bay segments for the selected parameter.