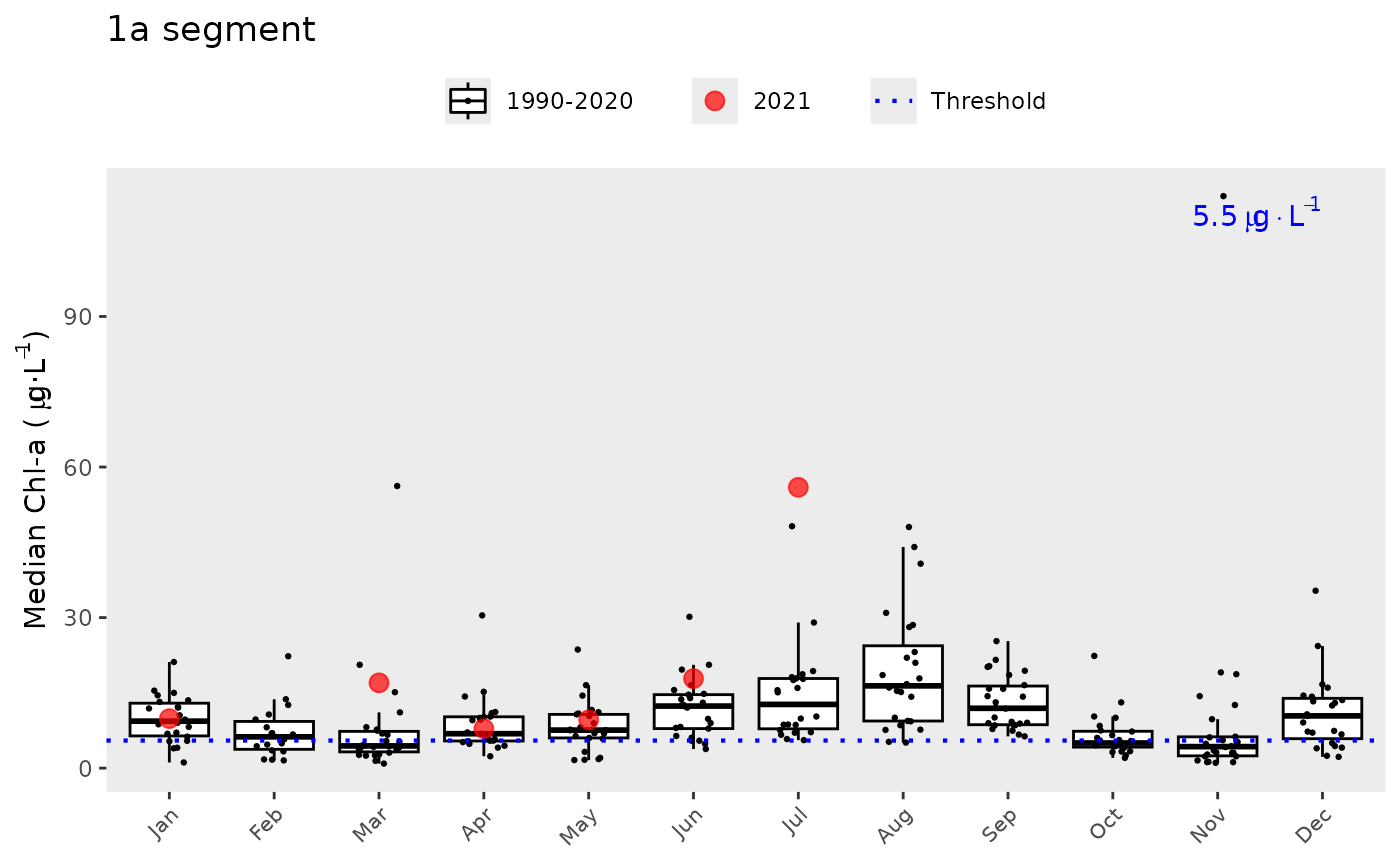
Plot monthly chlorophyll, secchi, or tn values values for a segment
show_boxpep.RdPlot monthly chlorophyl, secchi, or tn values values for a bay segment
Arguments
- dat
data frame of data returned by
read_pepwq- param
chr string indicating which water quality value and appropriate threshold to plot, one of "chla" for chlorophyll, "sd" for secchi depth, or "tn" for total nitrogen
- yrsel
numeric for year to emphasize, shown as separate red points on the plot
- yrrng
numeric vector indicating min, max years to include
- ptsz
numeric indicating point size of observations not in
yrsel- bay_segment
chr string for the bay segment, one of "1a", "1b", "2", or "3"
- trgs
optional
data.framefor annual bay segment water quality targets, defaults topeptargets- family
optional chr string indicating font family for text labels
- labelexp
logical indicating if y axis and target labels are plotted as expressions, default
TRUE- txtlab
logical indicating if a text label for the target value is shown in the plot
Value
A ggplot object
Details
Points not included in yrsel are plotted over the box plots using position_jitter. Use ptsz = -1 to suppress.