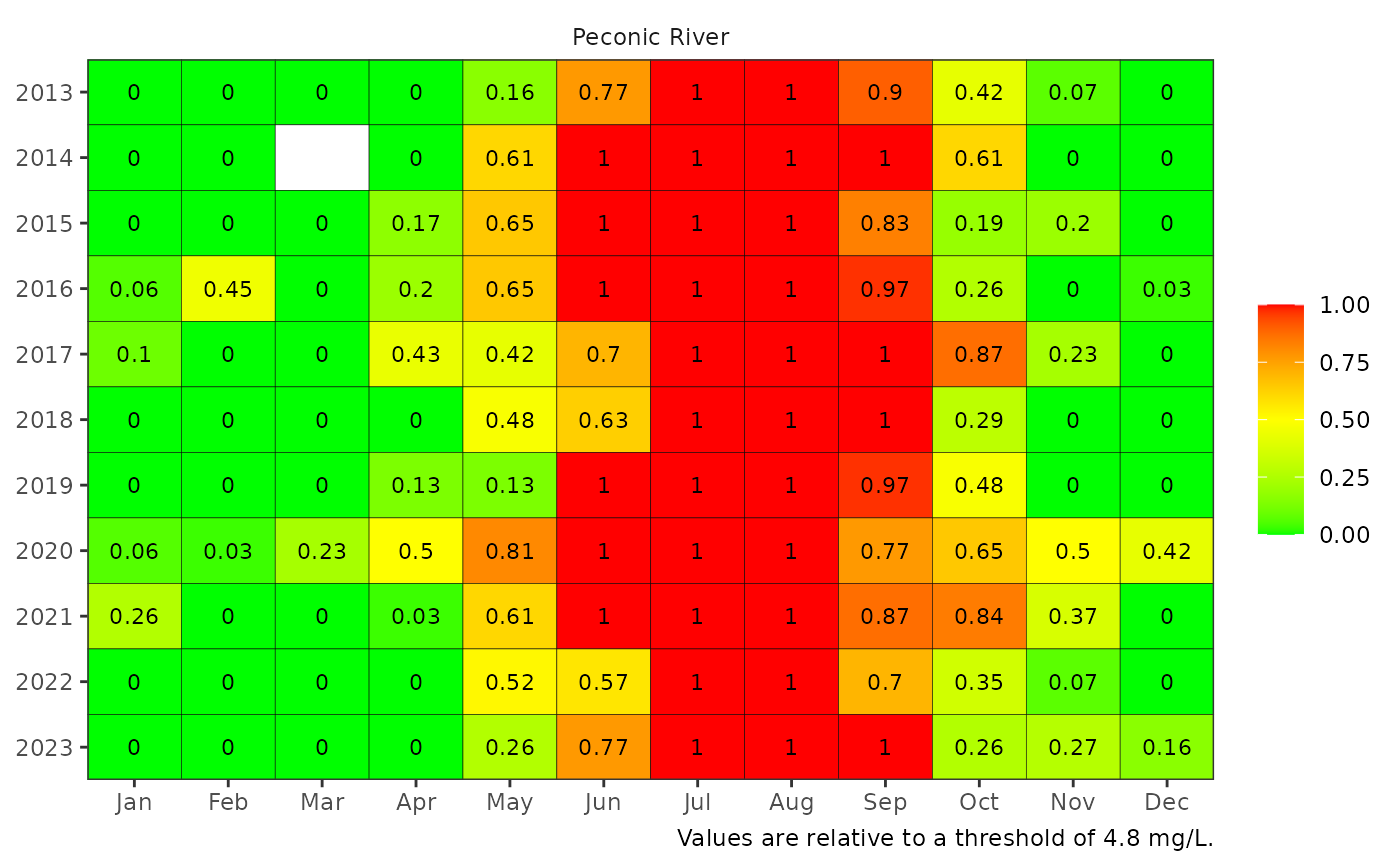
Create a colorized table for reporting dissolved oxygen data by site
show_domatrix.RdCreate a colorized table for reporting dissolved oxygen data by site
Usage
show_domatrix(
  dodat,
  site,
  show = c("below_ave", "below_maxrun"),
  txtsz = 3,
  thr = 4.8,
  impute = TRUE,
  yrrng = NULL,
  family = NA
)
Arguments
- dodat
data frame of dissolved oxygen data returned by
read_pepdo- site
character string of the site to plot taken from the
nmsargument inread_pepdo, usually one of"Peconic River","Orient Harbor", or"Shelter Island"- show
chr string indicating which summary value to plot from
anlz_domopep, one of'below_ave'or'below_maxrun'- txtsz
numeric for size of text in the plot, applies only if
asreact = FALSE- thr
numeric indicating appropriate dissolved oxygen thresholds, usually 3 mg/L for acute, 4.8 mg/L for chronic
- impute
logical indicating of missing dissolved oxygen values are imputed with the year, month, site average
- yrrng
numeric vector indicating min, max years to include
- family
optional chr string indicating font family for text labels
Value
A static ggplot object is returned.