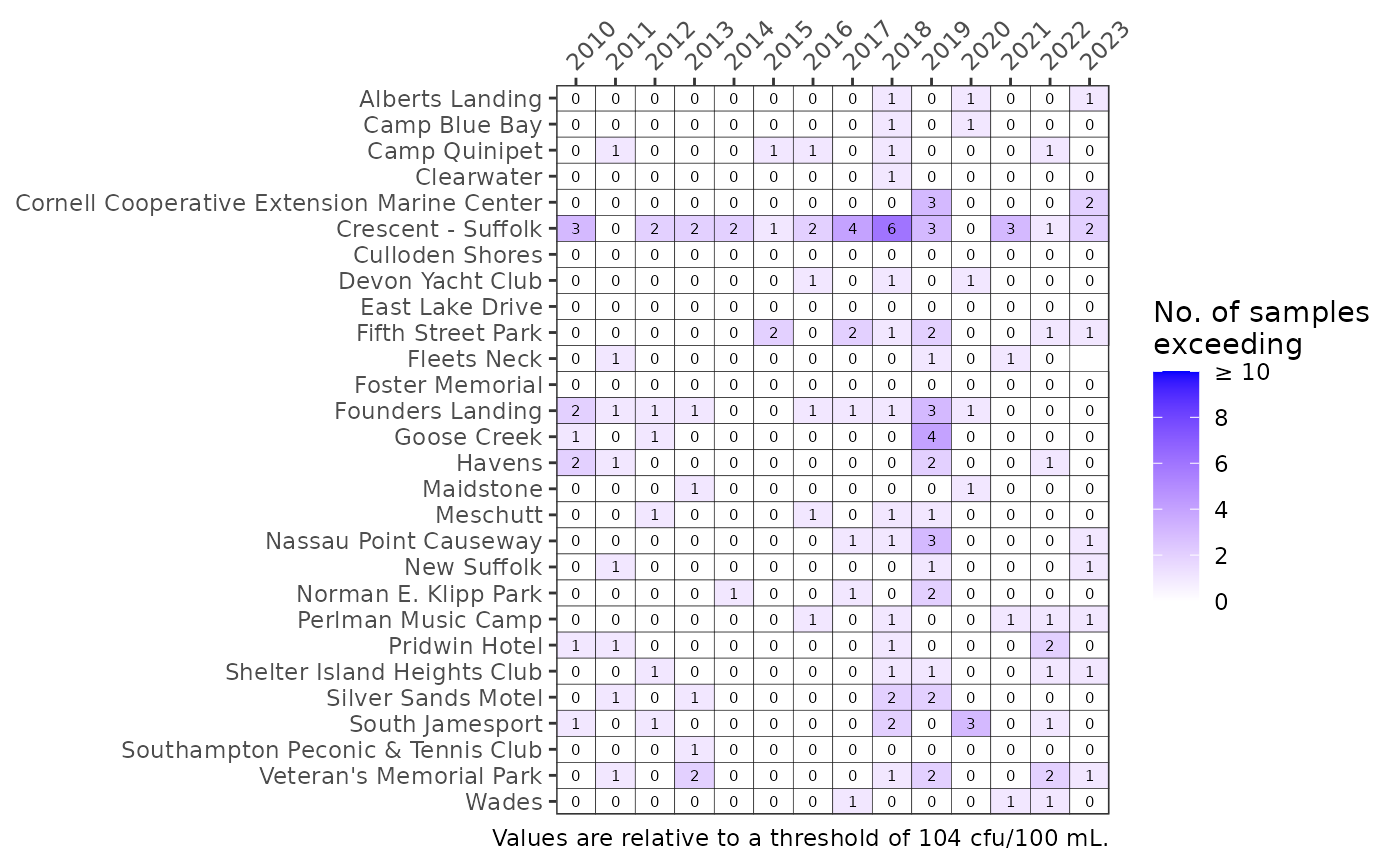
Create a colorized table for beach pathogen exceedances
show_entmatrix.RdCreate a colorized table for beach pathogen exceedances
Arguments
- entdat
data frame of enterococcus data returned by
read_pepent- txtsz
numeric for size of text in the plot, applies only if
asreact = FALSE- thr
numeric value defining threshold for exceedance
- yrrng
numeric vector indicating min, max years to include
- family
optional chr string indicating font family for text labels
Value
A static ggplot object is returned if asreact = FALSE, otherwise a reactable table is returned