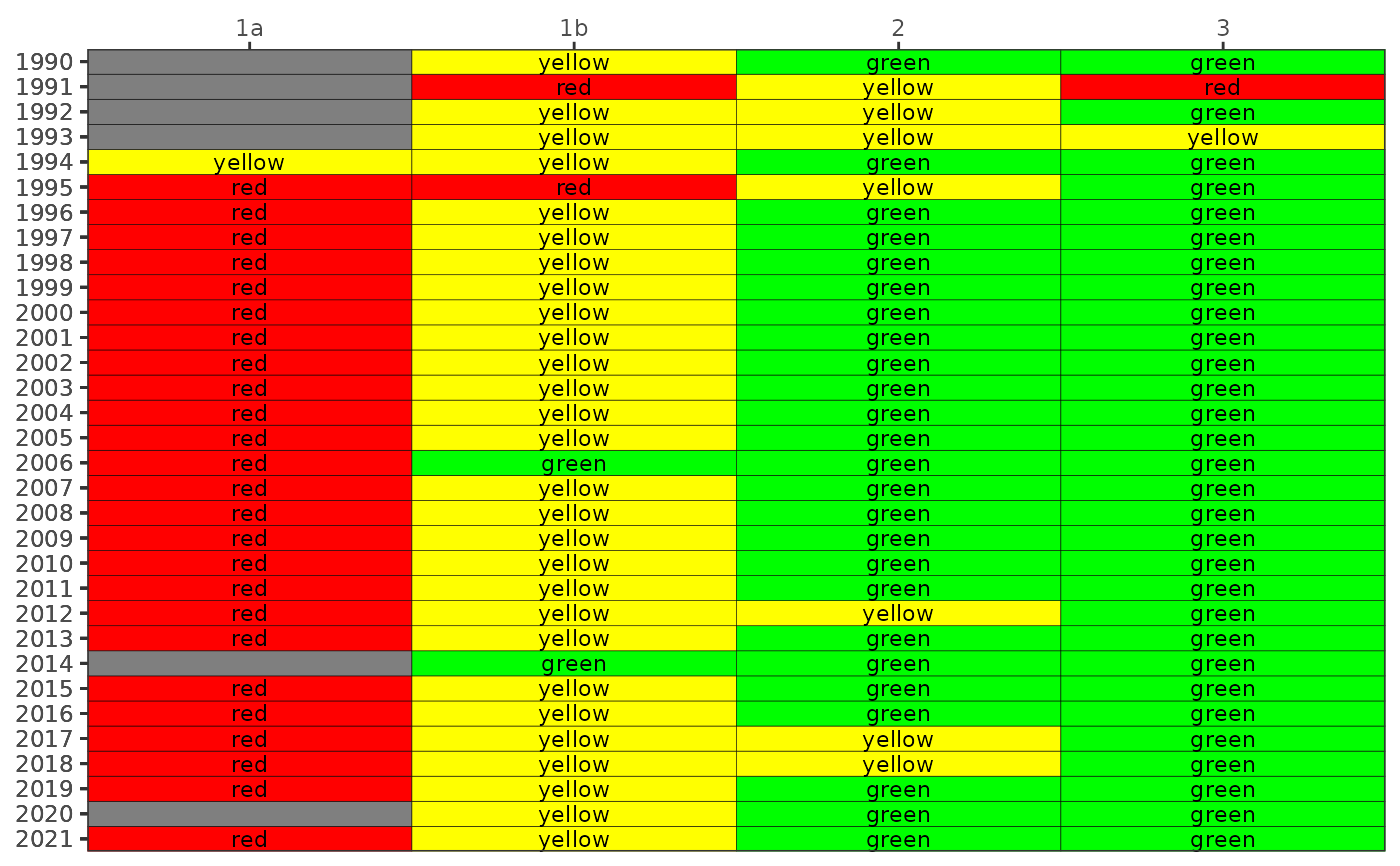
Create a colorized table for indicator reporting
show_matrixpep.RdCreate a colorized table for indicator reporting
Usage
show_matrixpep(
  dat,
  txtsz = 3,
  trgs = NULL,
  yrrng = NULL,
  bay_segment = c("1a", "1b", "2", "3"),
  asreact = FALSE,
  nrows = 10,
  abbrev = FALSE,
  family = NA
)
Arguments
- dat
data frame of water quality data returned by
read_pepwq- txtsz
numeric for size of text in the plot, applies only if
asreact = FALSE- trgs
optional
data.framefor annual bay segment water quality targets, defaults topeptargets- yrrng
numeric vector indicating min, max years to include
- bay_segment
chr string for bay segments to include, one to all of "1a", "1b", "2", or "3"
- asreact
logical indicating if a
reactableobject is returned- nrows
if
asreact = TRUE, a numeric specifying number of rows in the table- abbrev
logical indicating if text labels in the plot are abbreviated as the first letter
- family
optional chr string indicating font family for text labels