library(shiny)
ui <- fluidPage()
server <- function(input, output){}
shinyApp(ui = ui, server = server)1 Introduction
Shiny is an R package that lets you create rich, interactive web applications. Shiny lets you take an existing R script and expose it using a web browser so that you or anybody else can use it outside of R. Shiny is commonly used to:
- Communicate complex workflows to a non-technical audience with informative visualizations and interactive components
- Share your analysis easily with colleagues without having to walk them through details of your script
- Help inform your understanding of an analysis by creating a user interface to quickly evaluate data
In the applied sciences world, Shiny can be a very important tool to “bridge the research-management divide”. A very simple example is the use of Shiny to replace a 500 page document that has hundreds of figures with a simple application that allows the user to jump to an exact slice of the data that they want.
There are many advantages to using Shiny over other platforms for creating web applications. As R users, the value of Shiny is that you only need to know how to use R. You do not need to know anything about web programming, such as HTML, CSS, or JavaScript. On the other hand, Shiny gives you the power to tap into the broader suite of web programming tools when you’re ready or have a need to expand your application.
More simply, Shiny lets you create a web interface for any R workflow. This means that any custom analysis or graphic you’ve made can be fully integrated into your dashboard, unlike other platforms that may have rigid and less customizable templates.
2 Dynamic and Interactive applications
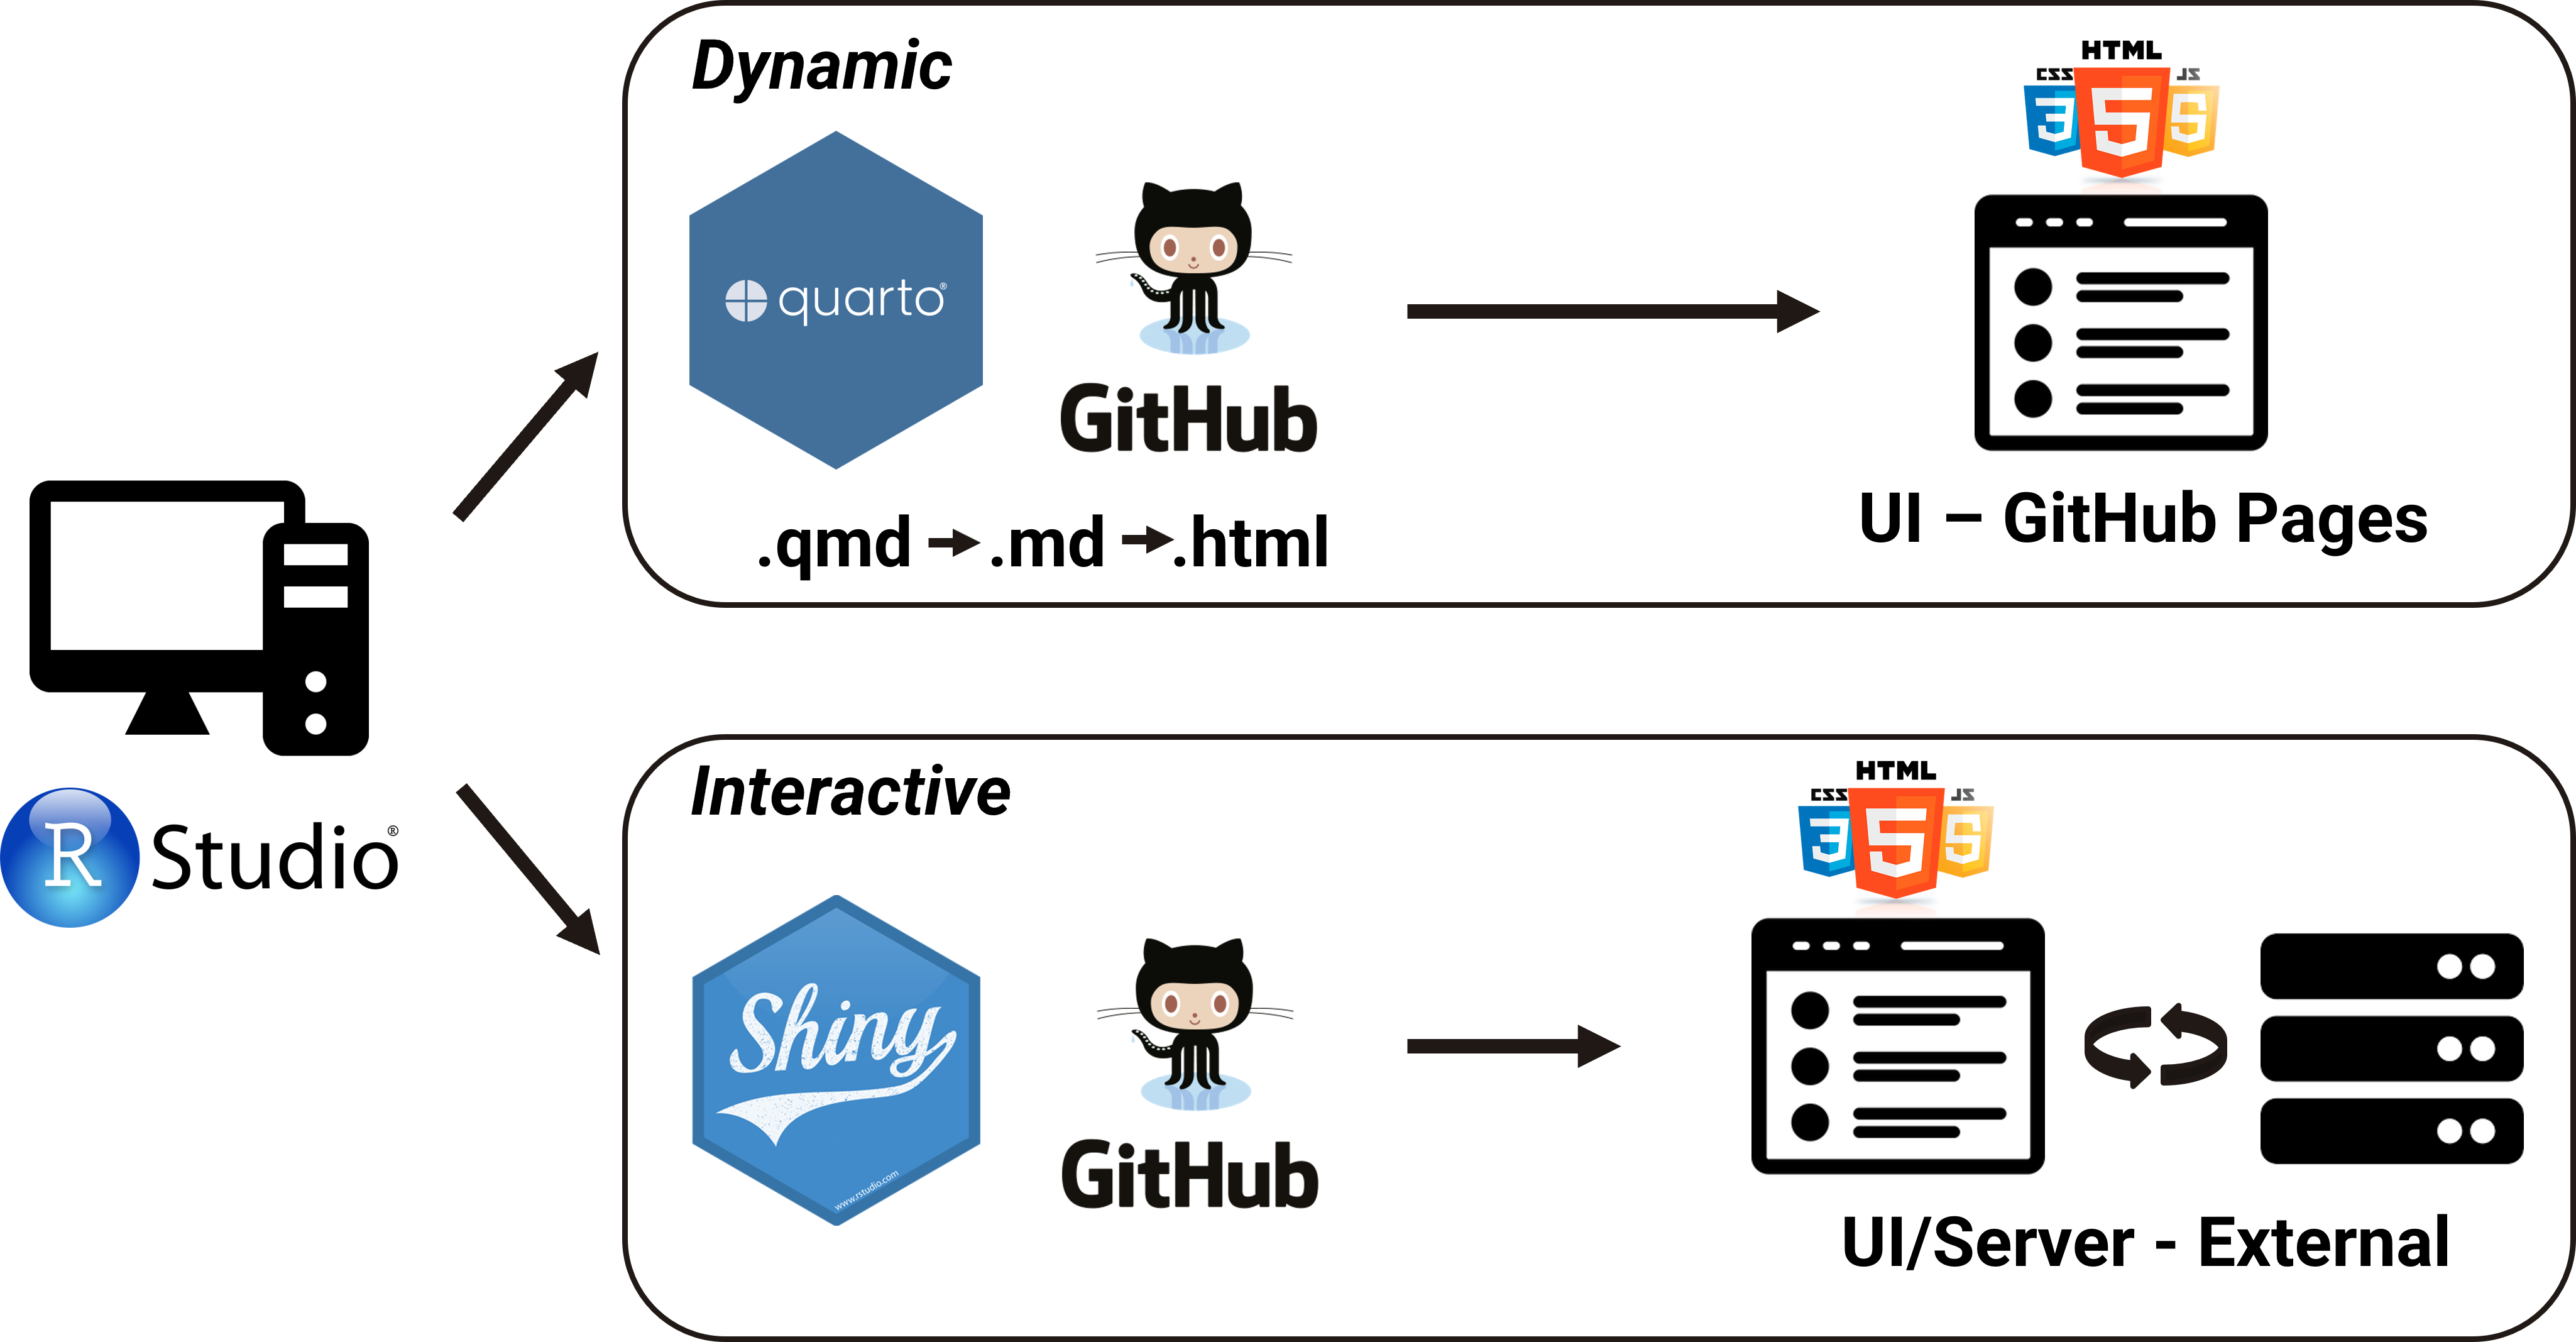
This workshop will expose you to the basics of creating interactive dashboards in R. Before we begin, it’s useful to distinguish between dynamic and interactive dashboards.
First, dynamic applications can have the look and feel of an interactive Shiny dashboard, but are fundamentally different. They are standalone and do not include a server component. Any interactive functionality is pre-built into the application and they are built before being hosted on a web platform as an HTML file. Applications such as Quarto (and its predecessor RMarkdown) can be used to create dynamic applications. Here’s an example.
By comparison, a Shiny application is fully interactive - it has both a user interface (UI) and server allowing a user to send requests to the server through the UI. This allows reactivity of the application components, where the content that a user sees on the UI is controlled by their inputs in a fully interactive experience. These applications require combined or separate R scripts that define the UI and server components. Here’s an example.
This workshop will cover both dynamic and interactive applications. Your needs for creating an application will determine which approach you use. In general, more complexity will require an interactive approach, but the rapidly evolving toolbox has greatly expanded the capabilities of dynamic applications. You may find that you can build a simpler dynamic application without having to integrate interactive Shiny components.
2.1 Reactivity
For dynamic applications, there’s not much you need to understand about coding beyond what you might already now about R. Creating the interactive components generally follows a familiar format. However, creating interactive applications in Shiny requires a fundamental shift in how you think about coding. It’s all done in R, but the pieces interact differently. You’re used to an R script from running top to bottom - code for a Shiny app runs up, down, and sideways depending on how you structure the components.
A Shiny app runs from an R script, but instead of executing code linearly, it uses reactive programming that detects when an input is changed on the application, runs the minimal amount of code that uses that input, then updates the output as needed. So, rather than thinking of the script as linear, think of it as having interconnected components that share pieces of information to produce the results.
This can be daunting at first because it requires you to think about which pieces of your code require inputs from other pieces and how that information is used to create output. Reactivity creates the building blocks of a Shiny app. Every Shiny app has the following:
- User interface (UI): Includes all inputs and outputs, as well as the appearance of the dashboard. Here, when we say “output” we mean the final product (e.g. a plot, table, etc.) that is placed on the
ui, but created by processing inputs sent to theserver. In web-speak, this is the front end. - Server: The guts or engine of how the inputs are used to create the outputs, this is where the working parts of your analysis live. It can be as simple or as complicated as you like. In web-speak, this is the back end.
At it’s core, a Shiny app is an R script that contains The ui and server components. In practice, it looks like this:
You “launch” or run the dashboard by sourcing the script or hitting the green “Run App” button on the top right.
If you run this code, you’ll see a local web browser pop up. It will be empty because this app does nothing - it’s just a template. All we need to do is populate the ui and server objects with code to do some things.
2.2 A simple example
Now let’s make our simple example do something. As with most problems, it’s good to start with identifying where you want to go and then work backwards to figure out how to get there. Let’s end with a simple histogram to visualize some data for the normal distribution, but with different sample sizes.
Changing the sample size:
To make a Shiny app out of this, we need to identify our inputs and outputs. The input in this case is what we want to be able to modify (the sample size) and the output is the plot. Inputs/outputs go in the ui object. The server takes the inputs, does something with them, then sends the results back to the ui. Putting this into our template would look something like this:
library(shiny)

ui <- fluidPage(
  numericInput(inputId = 'n', label = 'Sample size', value = 50),
  plotOutput('myplot')
)

server <- function(input, output){
  output$myplot <- renderPlot({
    dat <- rnorm(input$n)
    hist(dat)
  })
}

shinyApp(ui = ui, server = server)
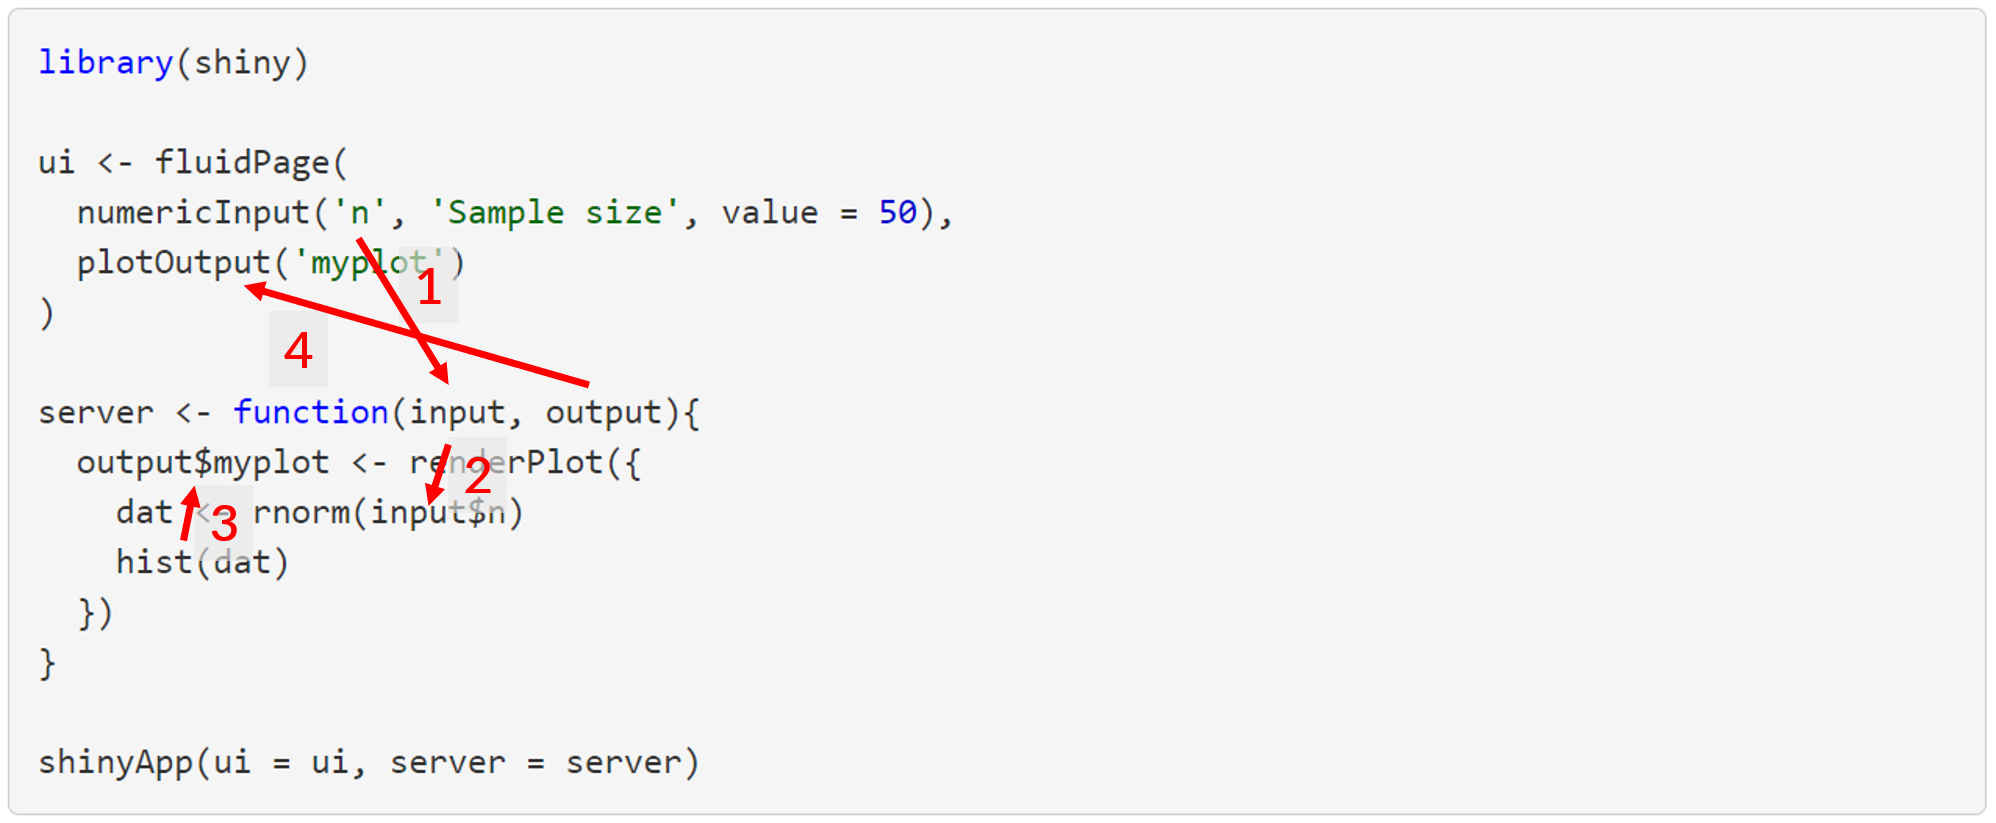
Okay, so what is happening under the hood when you change the sample size?
- The
inputvaluen(you name it) from theuiis sent to theserver, seen asinput$n. - The
datobject is created as a random sample with sizenand then a histogram is created as reactive output withrenderPlot - The plot output named
myplot(you name it) is appended to theoutputlist of objects in theserverfunction - The plot is then rendered on the
uiusingplotOutputby referencing themyplotname from theoutputobject
All of this happens each time the input values are changed, such that the output reacts to any change in the input. This is a fundamental principle of Shiny functionality, simplified as follows.
3 Next steps
Throughout this workshop, we’ll cover the fundamentals of web-based applications in R for actionable science. We’ll first talk about Quarto dynamic applications in Chapter 2 and then dive into Shiny interactive applications in Chapter 3. We’ll also discuss often overlooked but important concepts of the user experience when developing and engaging with a web application in Chapter 4. Throughout, we’ll highlight real applications that demonstrate how these operate in the wild for their intended uses, many of which are highlighted on our resources page.


