Plot seasonal metrics and rates of change
Usage
show_mettrndseason(
  mod,
  metfun = mean,
  doystr = 1,
  doyend = 364,
  justify = c("center", "left", "right"),
  win = 5,
  nsim = 10000,
  useave = FALSE,
  yromit = NULL,
  ylab,
  width = 0.9,
  size = 3,
  nms = NULL,
  fils = NULL,
  cmbn = F,
  base_size = 11,
  xlim = NULL,
  ylim = NULL,
  ...
)
Arguments
- mod
input model object as returned by
anlz_gam- metfun
function input for metric to calculate, e.g.,
mean,var,max, etc- doystr
numeric indicating start Julian day for extracting averages
- doyend
numeric indicating ending Julian day for extracting averages
- justify
chr string indicating the justification for the trend window
- win
numeric indicating number of years to use for the trend window, see details
- nsim
numeric indicating number of random draws for simulating uncertainty
- useave
logical indicating if
anlz_avgseasonis used for the seasonal metric calculation, see details- yromit
optional numeric vector for years to omit from the plot, see details
- ylab
chr string for y-axis label
- width
numeric for width of error bars
- size
numeric for point size
- nms
optional character vector for trend names, see details
- fils
optional character vector for the fill of interior point colors, see details
- cmbn
logical indicating if the no trend and no estimate colors should be combined, see details
- base_size
numeric indicating base font size, passed to
theme_bw- xlim
optional numeric vector of length two for x-axis limits
- ylim
optional numeric vector of length two for y-axis limits
- ...
additional arguments passed to
metfun, e.g.,na.rm = TRUE
Value
A ggplot object
Details
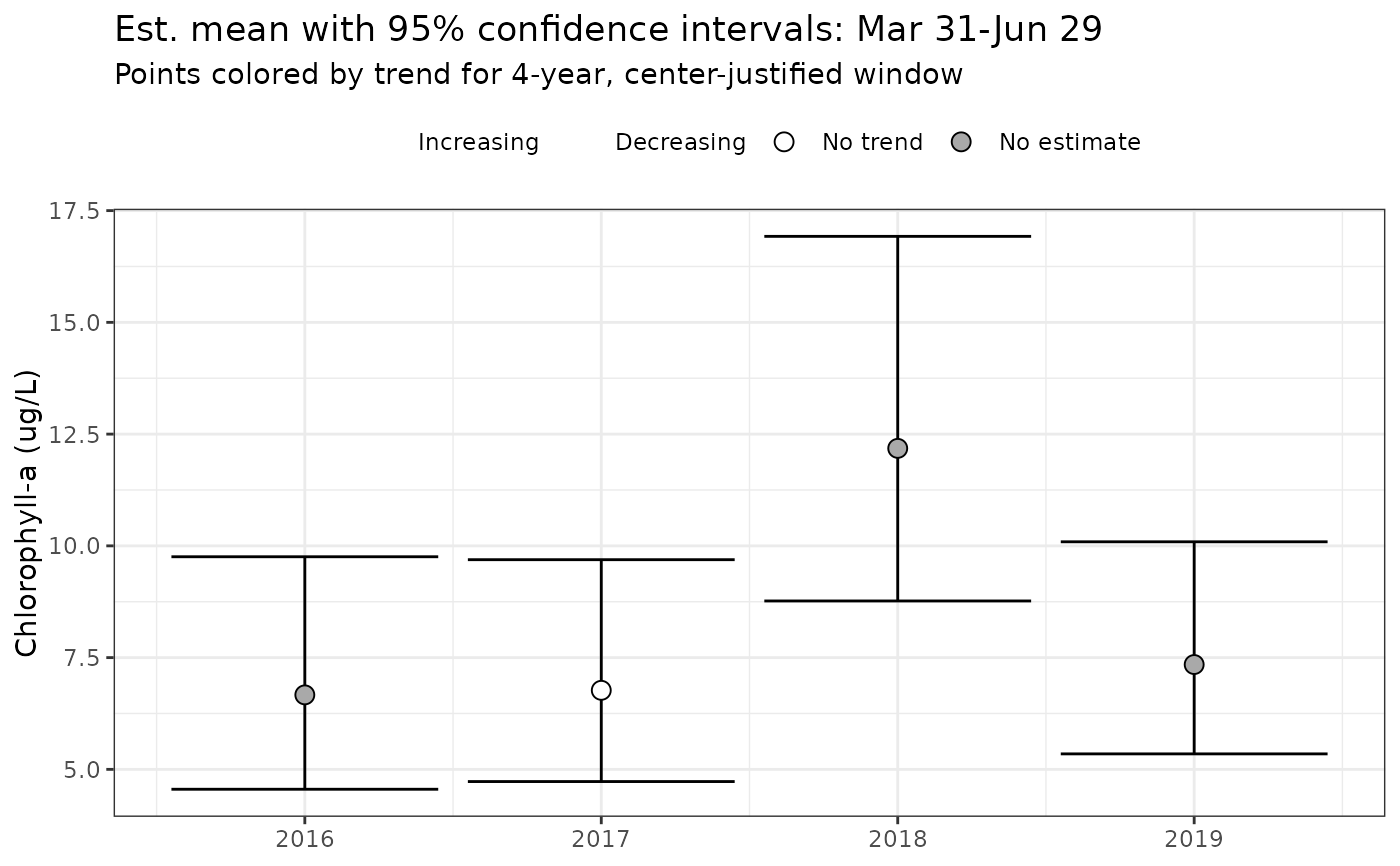
The plot is the same as that returned by show_metseason with the addition of points for the seasonal metrics colored by the trends estimated from anlz_trndseason for the specified window and justification.
Four colors are used to define increasing, decreasing, no trend, or no estimate (i.e., too few points for the window). The names and the colors can be changed using the nms and fils arguments, respectively. The cmbn argument can be used to combine the no trend and no estimate colors into one color and label. Although this may be desired for aesthetic reasons, the colors and labels may be misleading with the default names since no trend is shown for points where no estimates were made.
The optional yromit vector can be used to omit years from the plot and trend assessment. This may be preferred if seasonal estimates for a given year have very wide confidence intervals likely due to limited data, which can skew the trend assessments.