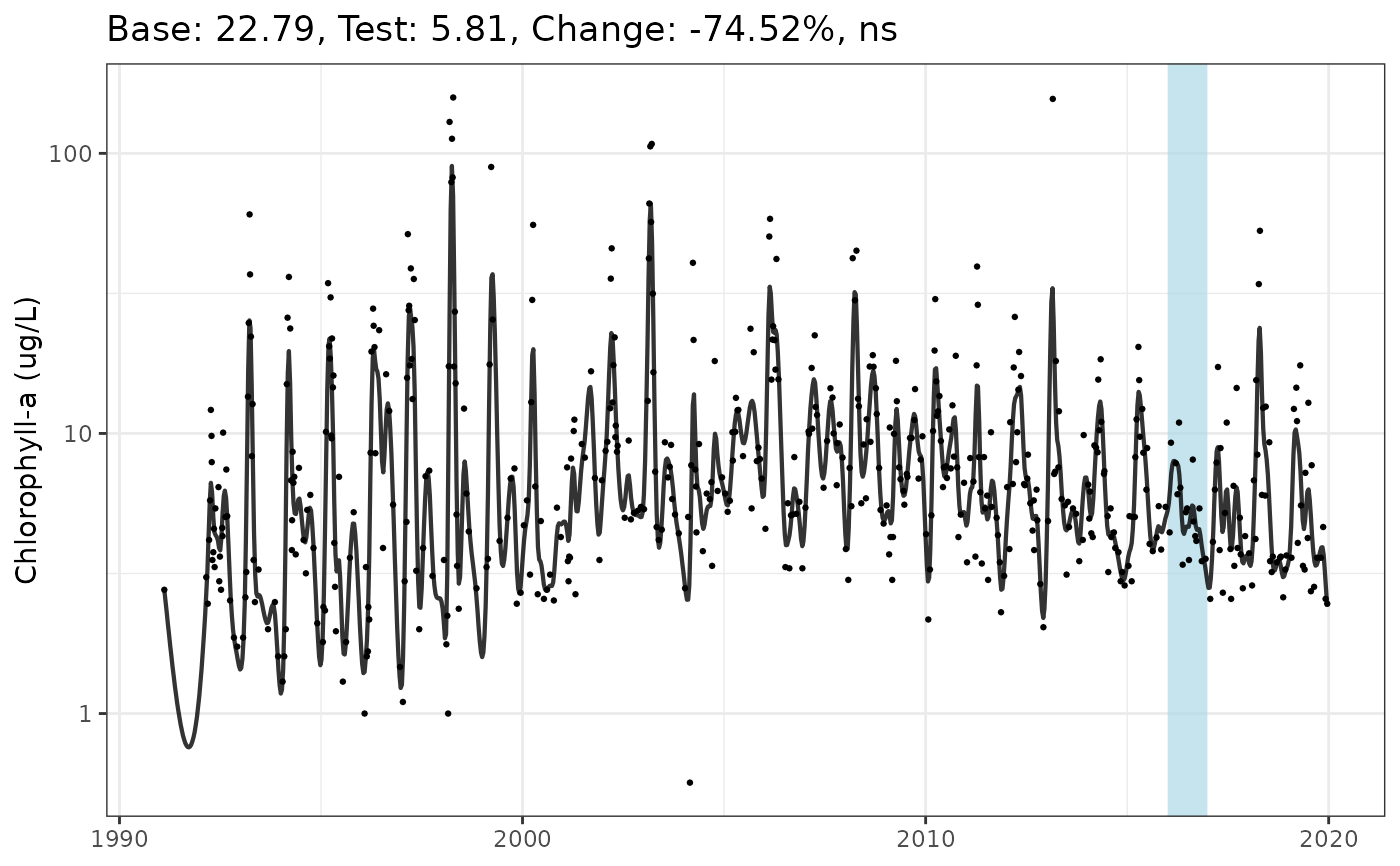
Plot percent change trends from GAM results for selected time periods
Source:R/show_perchg.R
show_perchg.RdPlot percent change trends from GAM results for selected time periods
Arguments
- mod
input model object as returned by
anlz_gam- baseyr
numeric vector of starting years
- testyr
numeric vector of ending years
- ylab
chr string for y-axis label
- base_size
numeric indicating base font size, passed to
theme_bw- xlim
optional numeric vector of length two for x-axis limits
- ylim
optional numeric vector of length two for y-axis limits
Value
A ggplot object