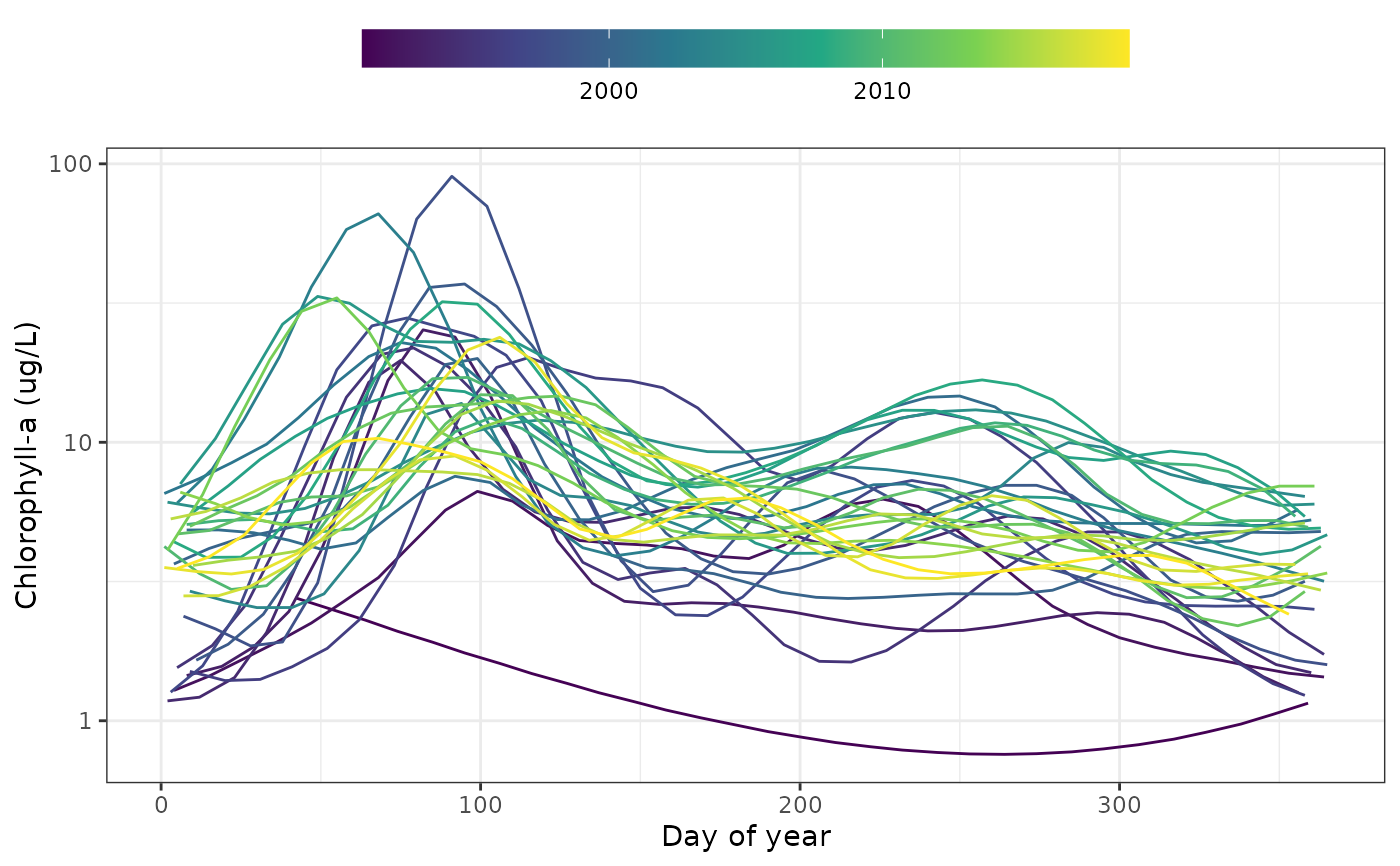
Plot predictions for GAMs against day of year
Arguments
- mod
input model object as returned by
anlz_gam- ylab
chr string for y-axis label
- yromit
optional numeric vector for years to omit from the plot, see details
- size
numeric indicating line size
- alpha
numeric from 0 to 1 indicating line transparency
- base_size
numeric indicating base font size, passed to
theme_bw
Value
A ggplot object
Details
The optional yromit vector can be used to omit years from the plot. This may be preferred if the predicted values from the model deviate substantially from other years likely due to missing data.
Examples
library(dplyr)
# data to model
tomod <- rawdat %>%
filter(station %in% 34) %>%
filter(param %in% 'chl')
mod <- anlz_gam(tomod, trans = 'log10')
show_prddoy(mod, ylab = 'Chlorophyll-a (ug/L)')
#> Warning: Using `size` aesthetic for lines was deprecated in ggplot2 3.4.0.
#> ℹ Please use `linewidth` instead.
#> ℹ The deprecated feature was likely used in the wqtrends package.
#> Please report the issue at <https://github.com/tbep-tech/wqtrends/issues>.