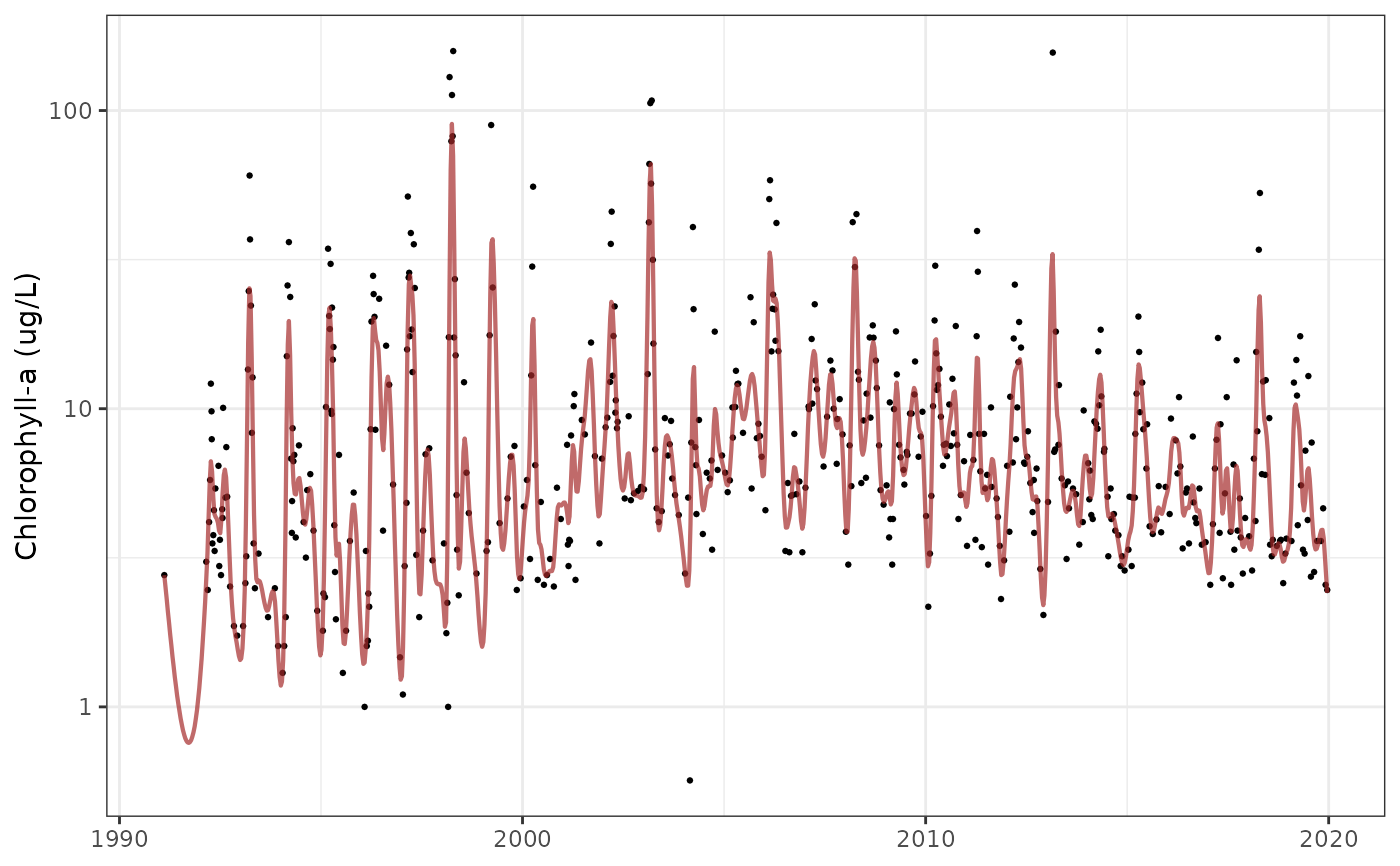
Plot predictions for GAMs over time series
Usage
show_prdseries(
  mod,
  ylab,
  yromit = NULL,
  alpha = 0.7,
  base_size = 11,
  xlim = NULL,
  ylim = NULL,
  col = "brown",
  minomit = 8
)
Arguments
- mod
input model object as returned by
anlz_gam- ylab
chr string for y-axis label
- yromit
optional numeric vector for years to omit from the plot, see details
- alpha
numeric from 0 to 1 indicating line transparency
- base_size
numeric indicating base font size, passed to
theme_bw- xlim
optional numeric vector of length two for x-axis limits
- ylim
optional numeric vector of length two for y-axis limits
- col
optional chr string for line color
- minomit
numeric indicating number of observations in the observed data to exclude in the predicted series for a given year if provided to
yromit
Value
A ggplot object
Details
The optional yromit vector can be used to omit years from the plot. This may be preferred if the predicted values from the model deviate substantially from other years likely due to missing data.
The yromit argument behaves differently for this function compared to others because of a mismatch in the timestep for the predicted time series and the observed data. The function will attempt to find "bookends" in the observed data that match with the predicted time series for each year in yromit. For example, if there is a gap in the observed data that spans multiple years and a single year value is included with yromit that is within the gap, the predicted time series will not be shown for the entire gap in the observed data even if additional years within the gap were not provided to yromit.
Entire years where observed data are present can also be removed from the predicted time series if they exceed a minimum number of observations defined by minomit. For example, if a year has at least 8 observations and yromit includes that year, the predicted time series for that entire year will be removed.