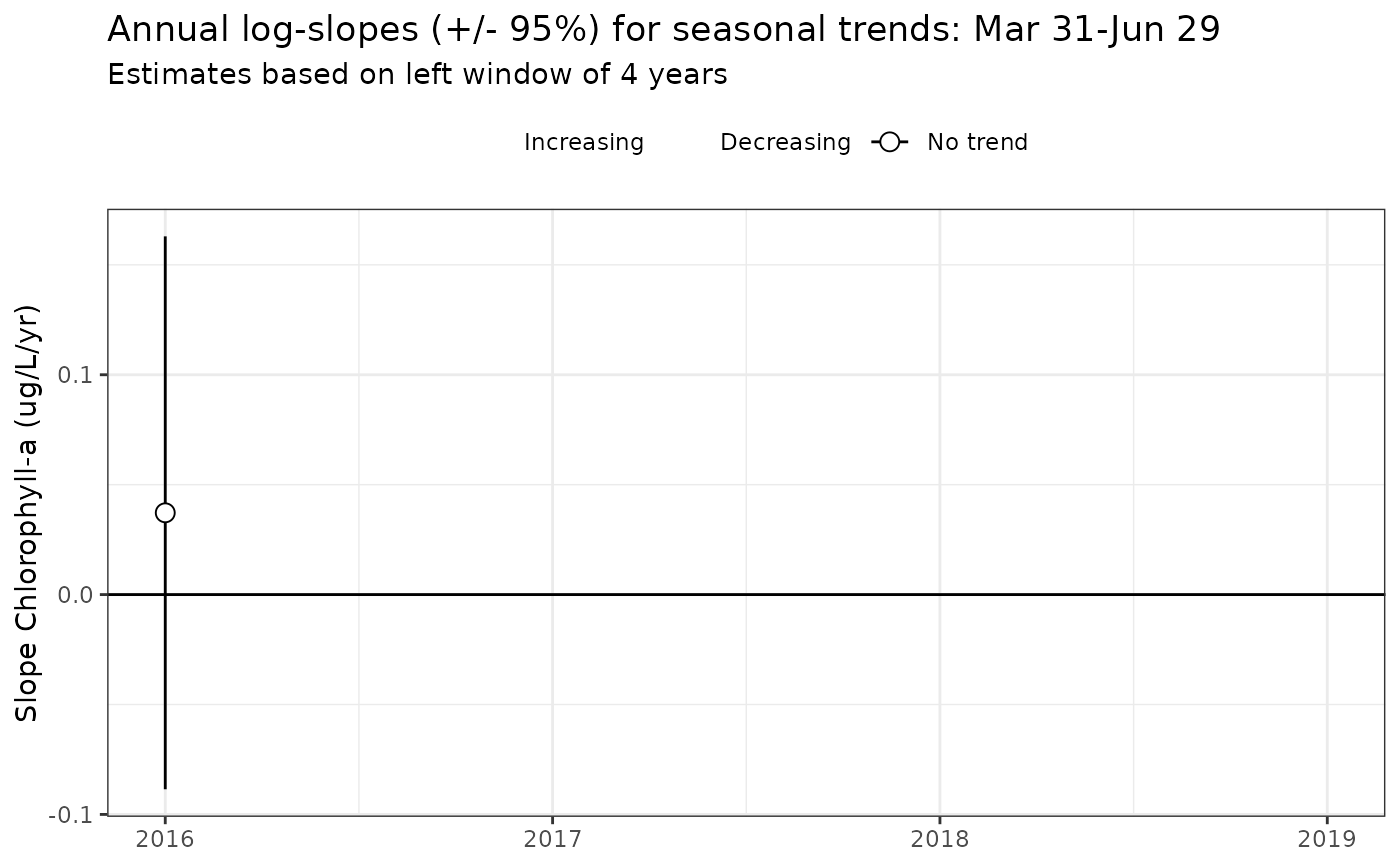
Plot rates of change based on seasonal metrics
Arguments
- mod
input model object as returned by
anlz_gam- metfun
function input for metric to calculate, e.g.,
mean,var,max, etc- doystr
numeric indicating start Julian day for extracting averages
- doyend
numeric indicating ending Julian day for extracting averages
- type
chr string indicating if log slopes are shown (if applicable)
- justify
chr string indicating the justification for the trend window
- win
numeric indicating number of years to use for the trend window, see details
- ylab
chr string for y-axis label
- nsim
numeric indicating number of random draws for simulating uncertainty
- yromit
optional numeric vector for years to omit from the output
- useave
logical indicating if
anlz_avgseasonis used for the seasonal metric calculation, see details- base_size
numeric indicating base font size, passed to
theme_bw- nms
optional character vector for trend names
- fils
optional character vector for the fill of interior point colors
- cols
optional character vector for confidence interval colors
- xlim
optional numeric vector of length two for x-axis limits
- ylim
optional numeric vector of length two for y-axis limits
- ...
additional arguments passed to
metfun, e.g.,na.rm = TRUE
Value
A ggplot object
