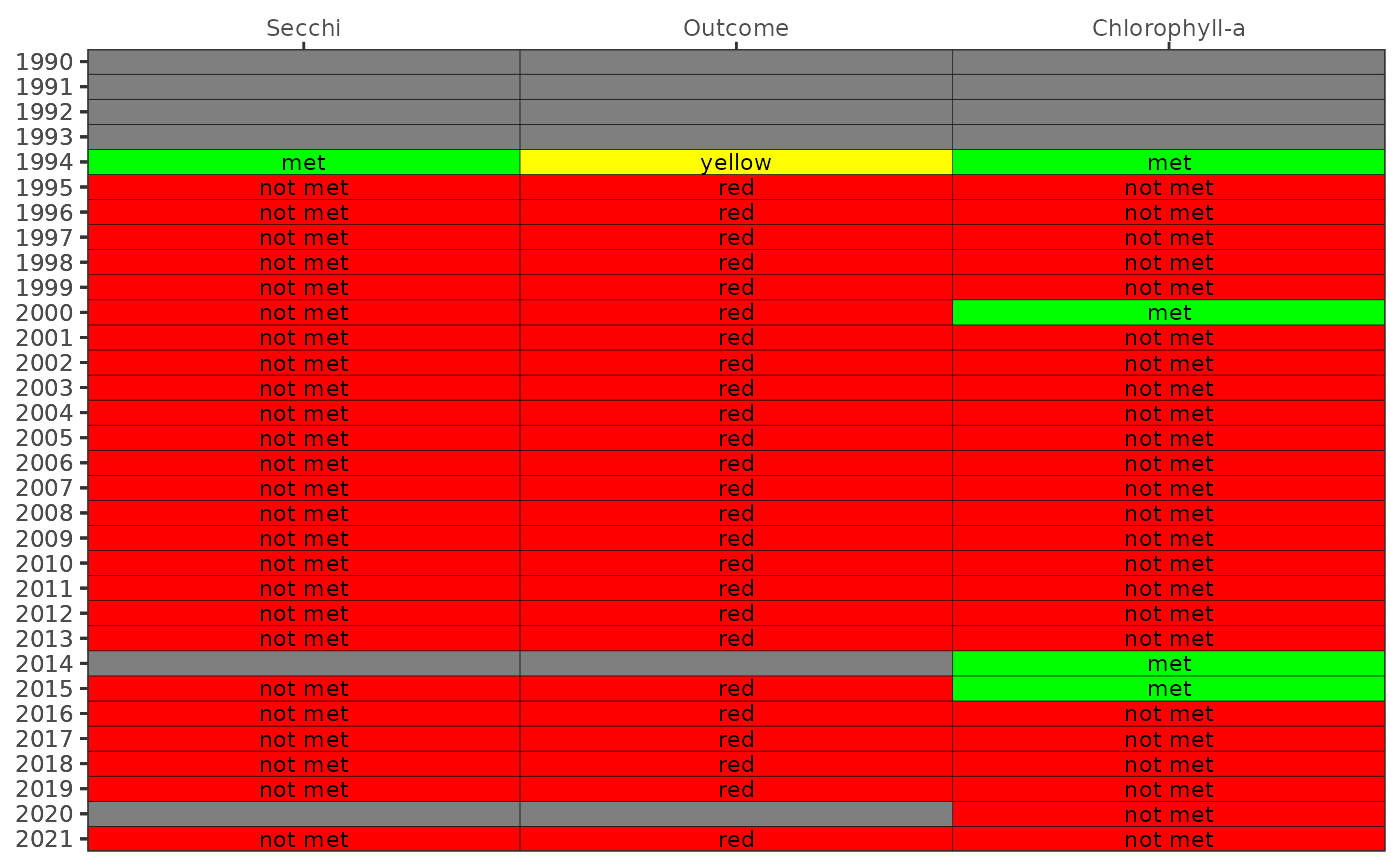
Create a colorized table for water quality outcomes and exceedances by segment
show_segmatrixpep.RdCreate a colorized table for water quality outcomes by segment that includes the management action and chlorophyll, and secchi exceedances
Usage
show_segmatrixpep(
  dat,
  txtsz = 3,
  trgs = NULL,
  yrrng = NULL,
  bay_segment = c("1a", "1b", "2", "3"),
  abbrev = FALSE,
  family = NA
)
Arguments
- dat
data.frameformatted fromread_pepwq- txtsz
numeric for size of text in the plot, applies only if
tab = FALSE- trgs
optional
data.framefor annual bay segment water quality targets, defaults topeptargets- yrrng
numeric vector indicating min, max years to include
- bay_segment
chr string for bay segments to include, one to all of "1a", "1b", "2", or "3"
- abbrev
logical indicating if text labels in the plot are abbreviated as the first letter, applies only to center column
- family
optional chr string indicating font family for text labels
Value
A static ggplot object is returned
Details
This function provides a combined output for the show_wqmatrixpep and show_matrixpep functions. Only one bay segment can be plotted for each function call.