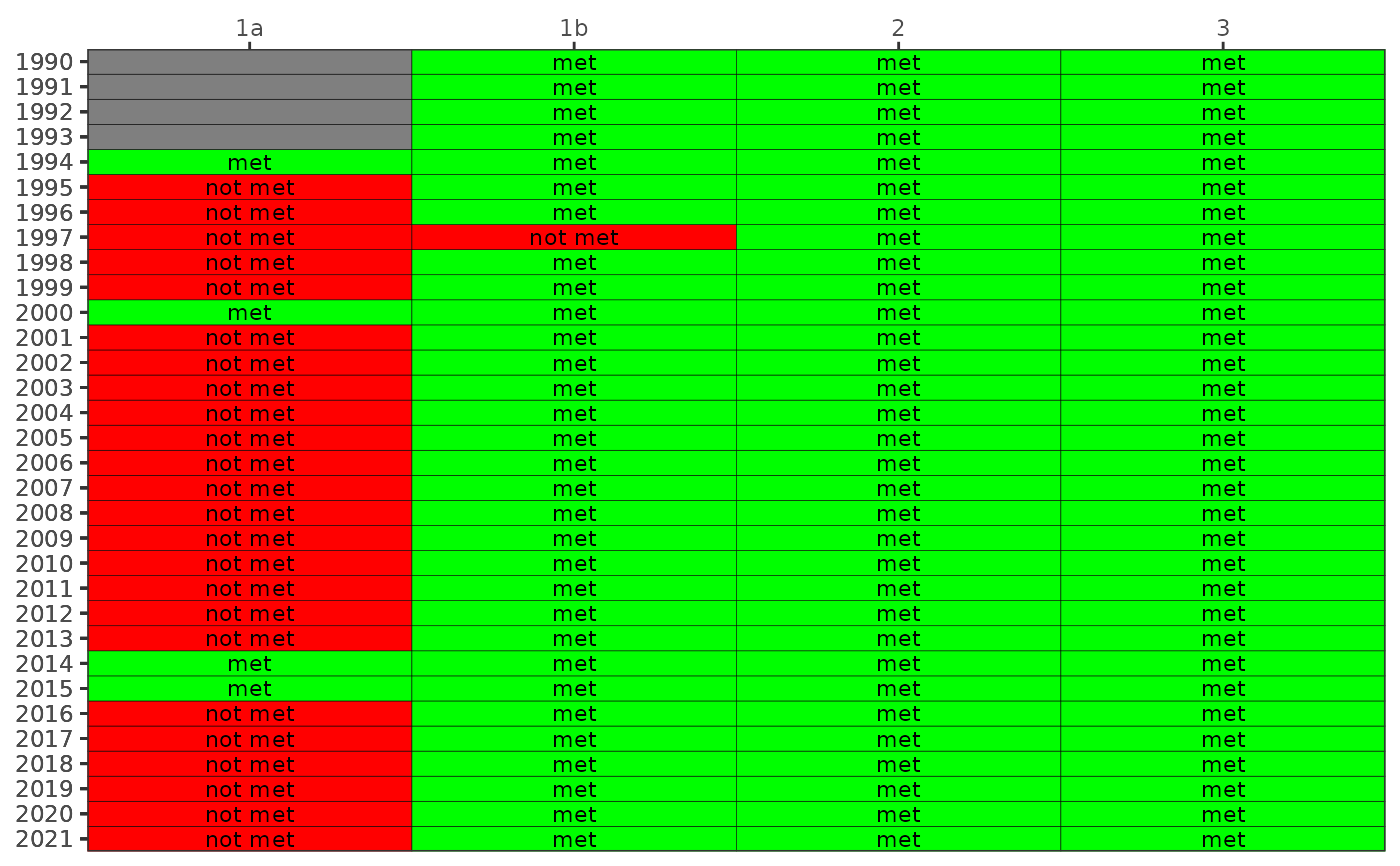
Create a colorized table for chlorophyll or secchi exceedances
show_wqmatrixpep.RdCreate a colorized table for chlorophyll or secchi exceedances
Arguments
- dat
data.frameformatted fromread_pepwq- param
chr string for which parameter to plot, one of
"chla"for chlorophyll or"sd"for secchi- txtsz
numeric for size of text in the plot, applies only if
tab = FALSE- trgs
optional
data.framefor annual bay segment water quality targets, defaults topeptargets- yrrng
numeric vector indicating min, max years to include
- alpha
numeric indicating color transparency
- bay_segment
chr string for bay segments to include, one to all of "1a", "1b", "2", or "3"
- asreact
logical indicating if a
reactableobject is returned- nrows
if
asreact = TRUE, a numeric specifying number of rows in the table- family
optional chr string indicating font family for text labels
Value
A static ggplot object is returned if asreact = FALSE, otherwise a reactable table is returned