Elevation
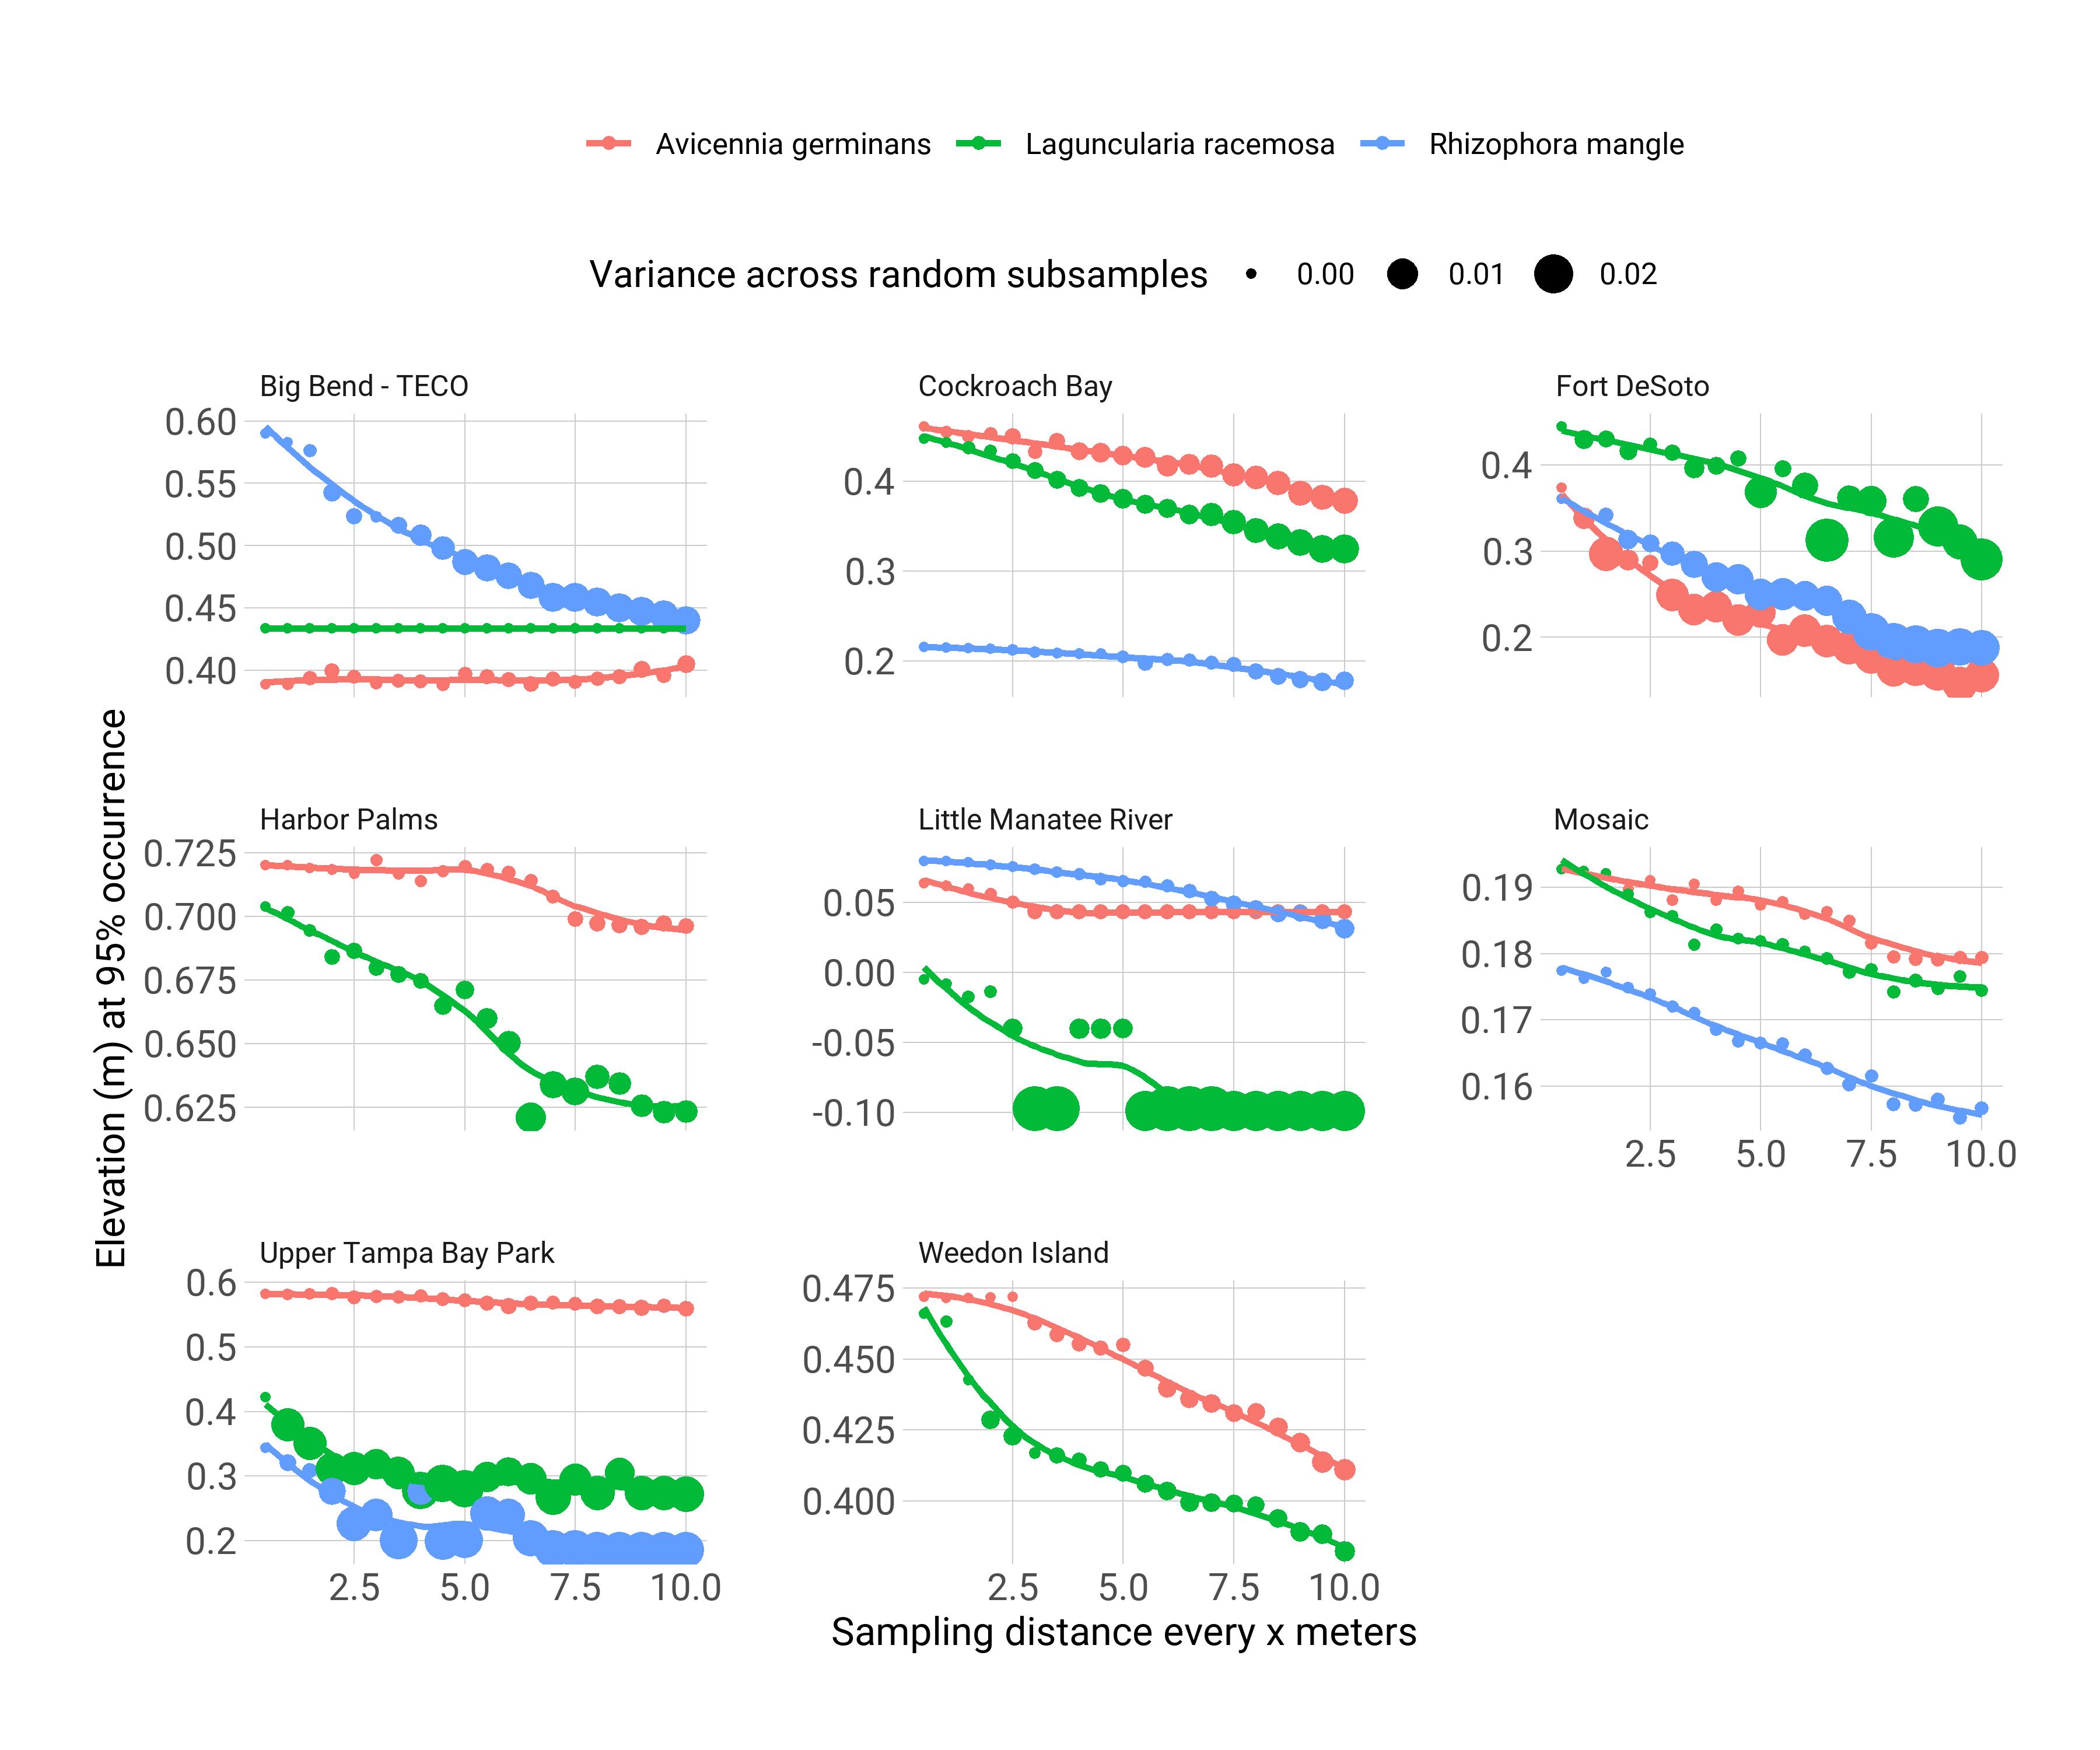
These plots show elevation estimates for mangrove species (black mangrove Avicennia germinans, white mangrove Laguncularia racemosa, red mangrove Rhizophore mangle) with reductions in sampling every 0.5 m to every 10 m. For each level of sampling effort, the estimated elevation at which 95% of each species occurs is shown for each site. The variance in the estimated elevation is also shown for the repeated subsamples at each level of effort. Overall, the elevation estimates show a decrease with reductions in effort, although differences are observed for each species and site.
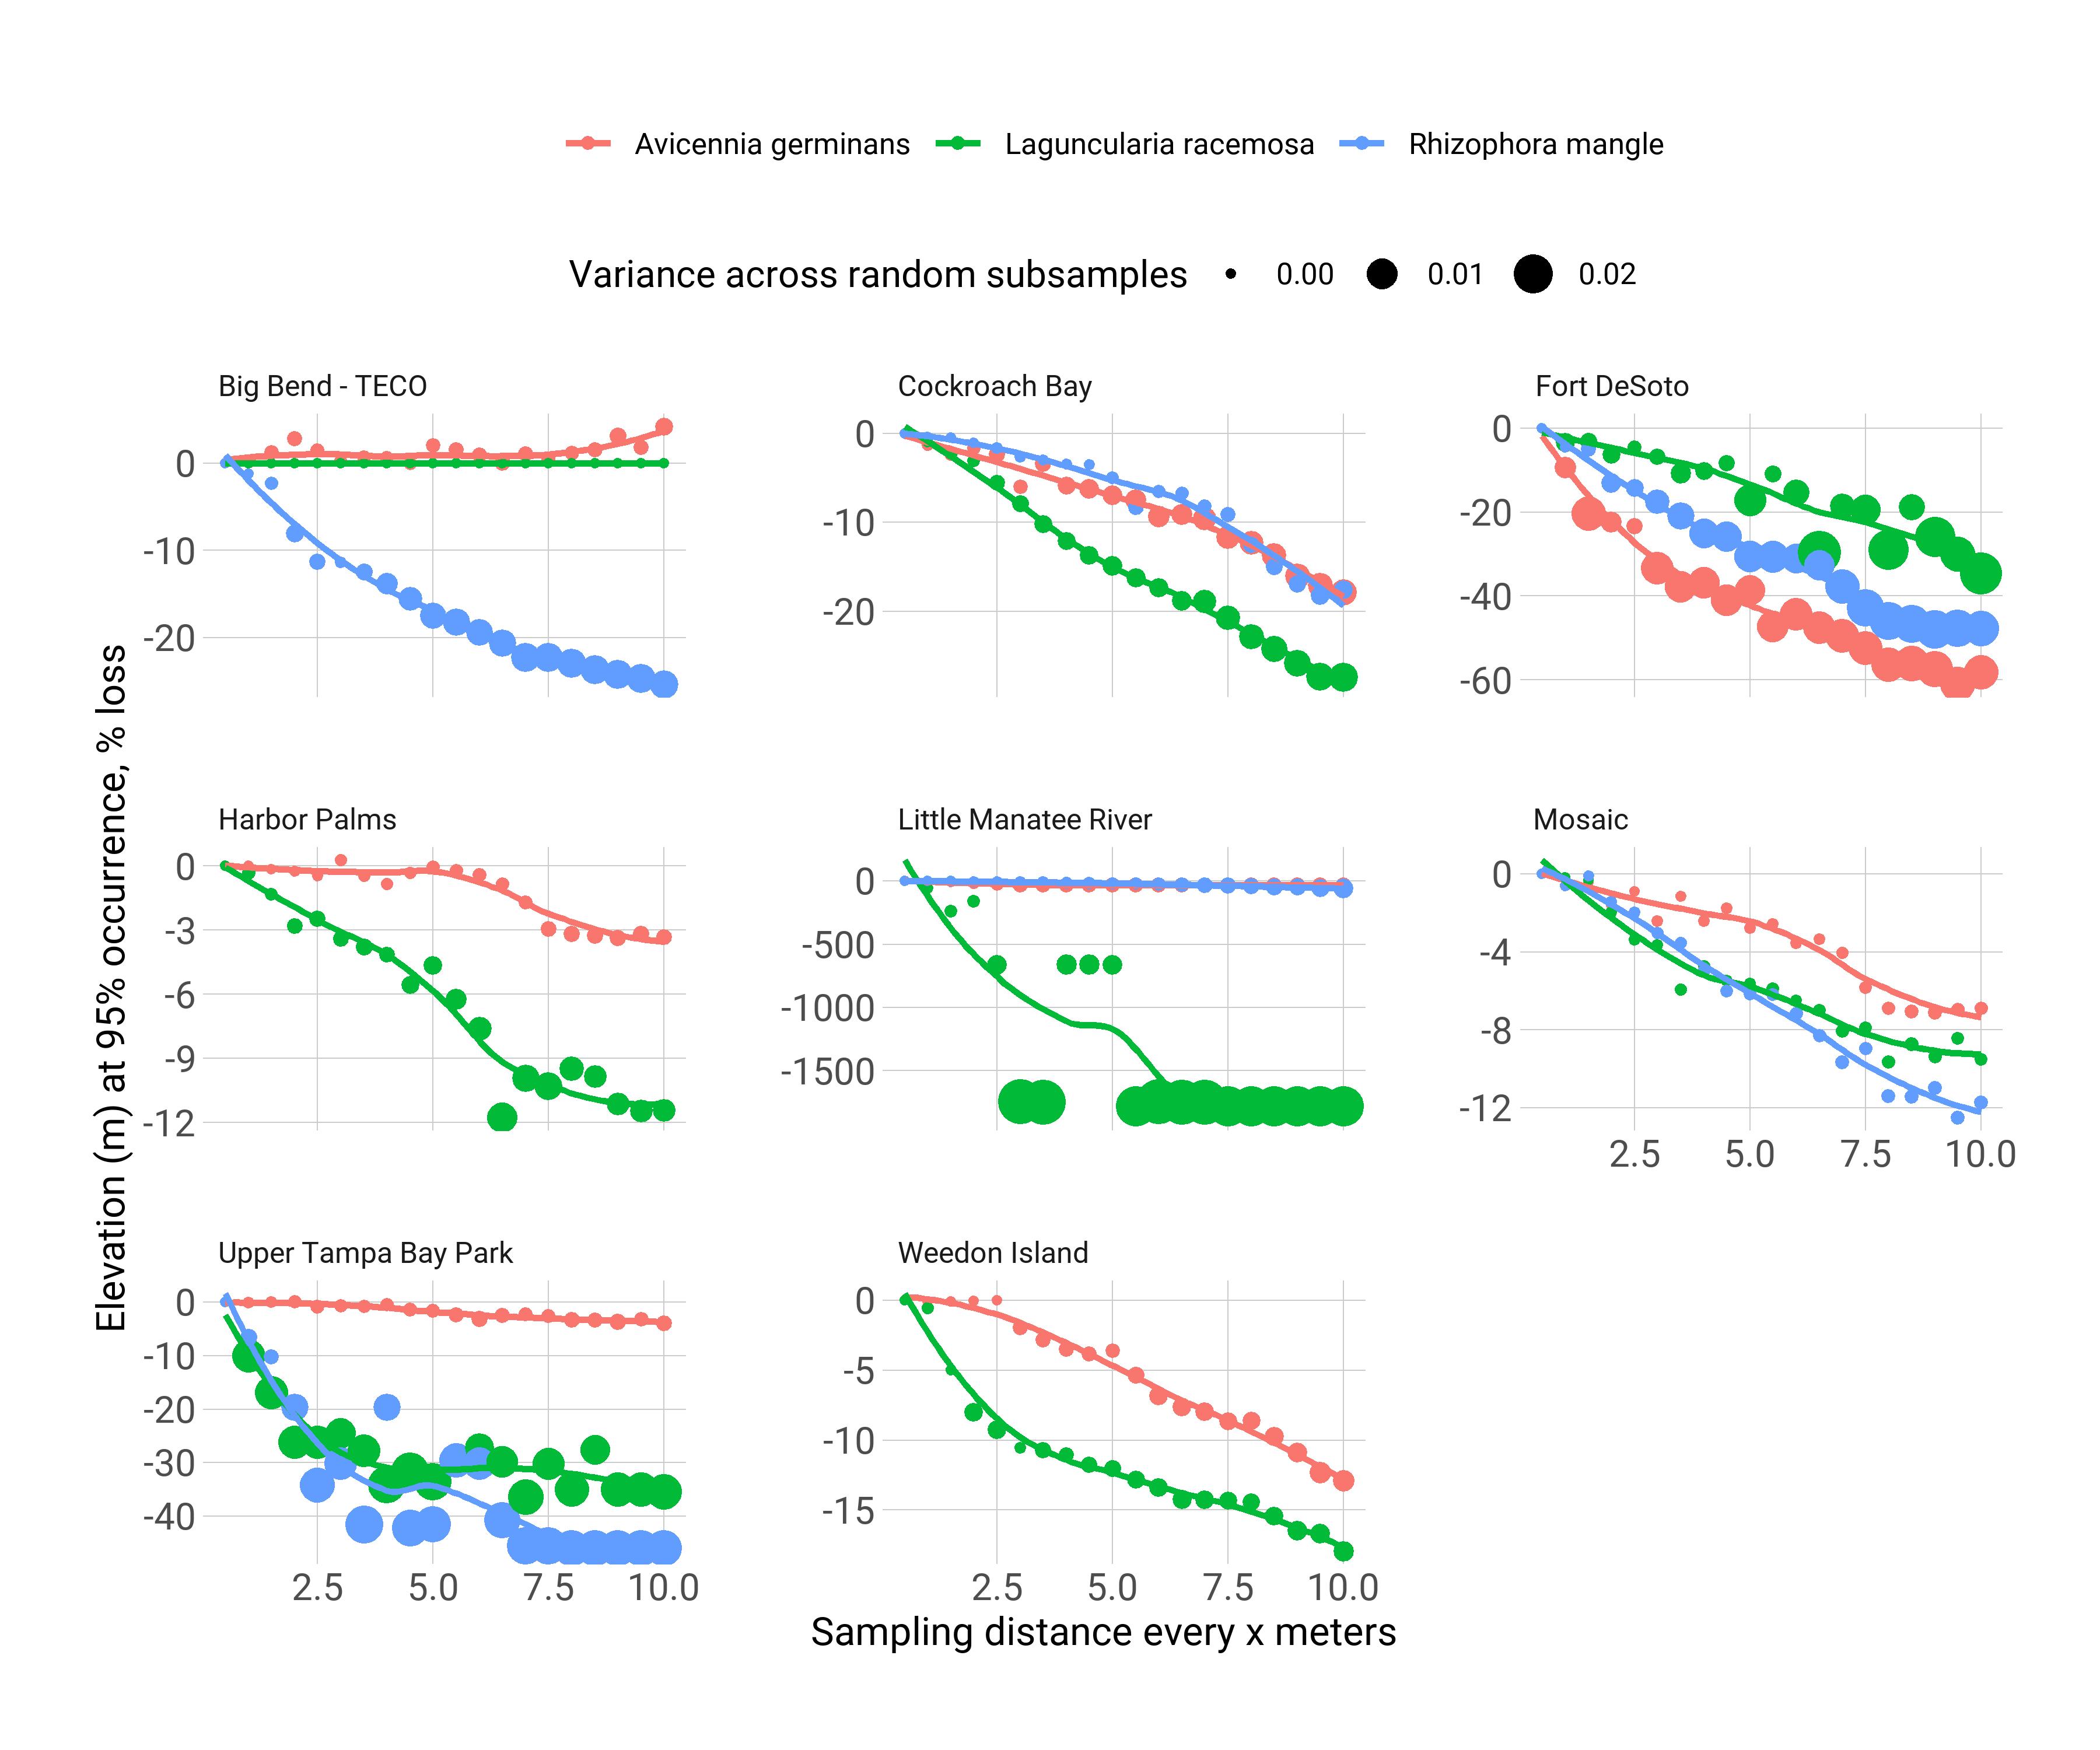
These plots are similar to the above, except the total elevation change for each species at each site is shown as percent change. This provides a comparison of changes where differences may be observed by starting elevation above sea level.
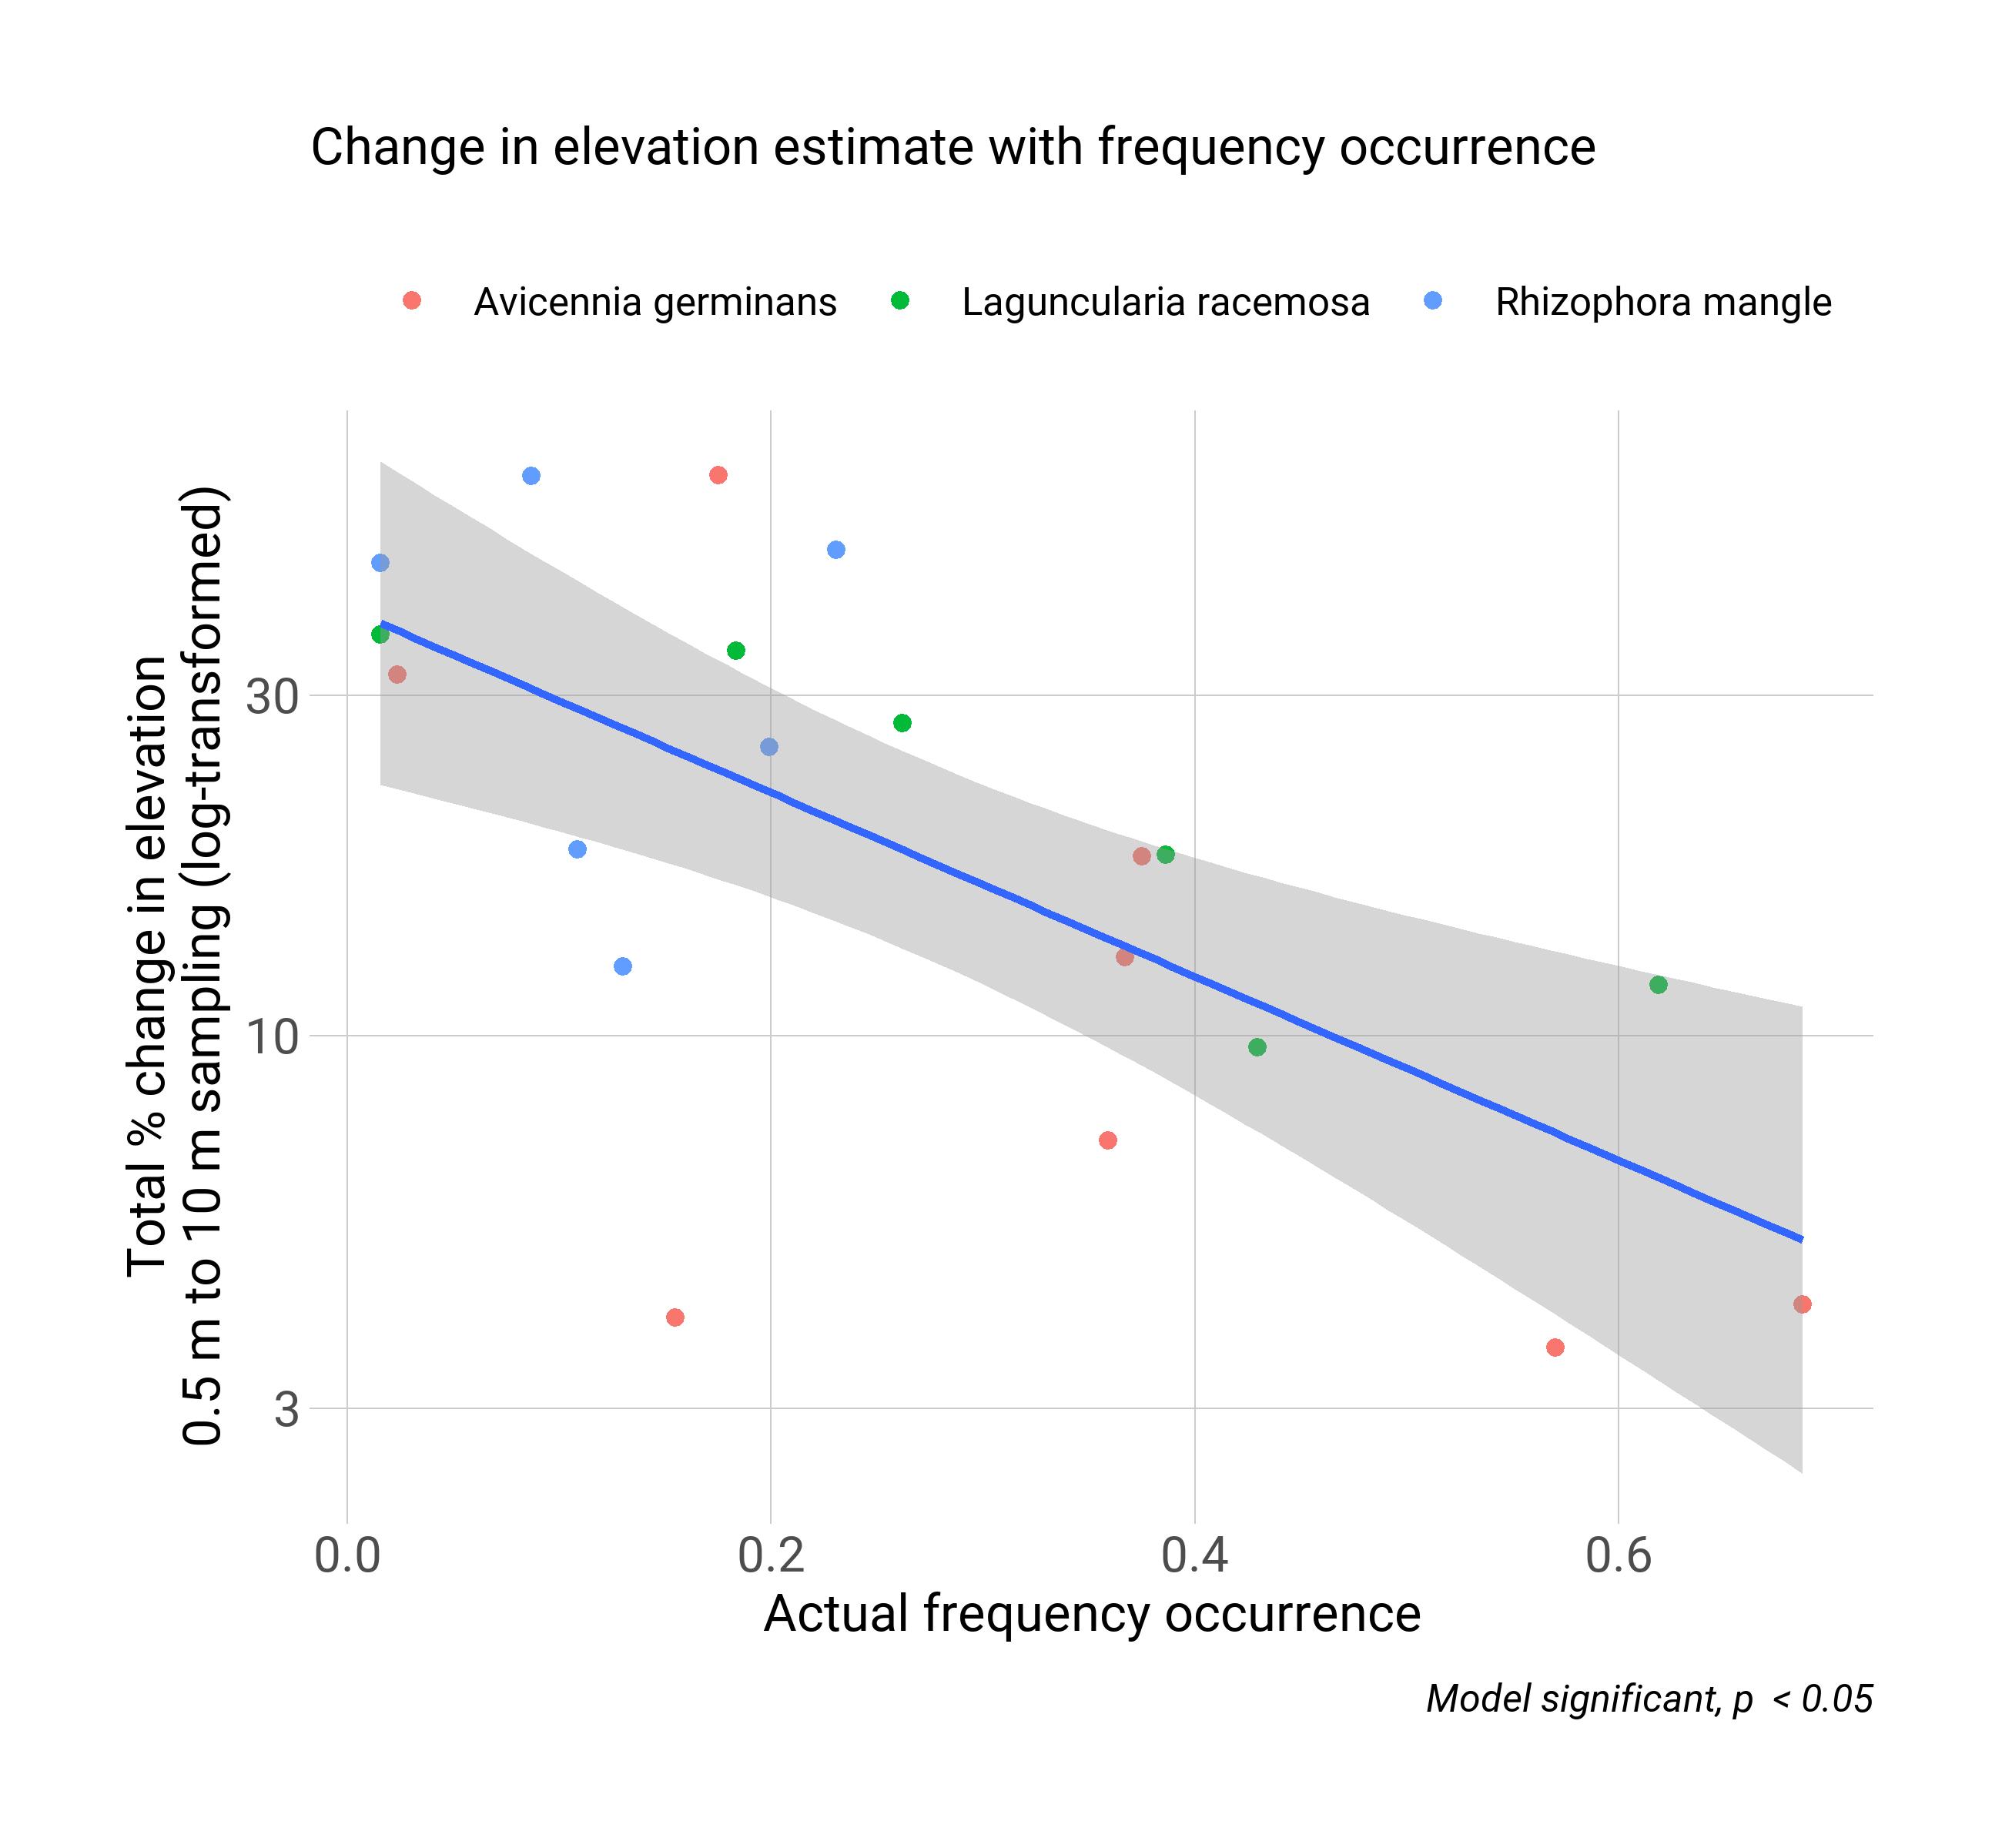
This plot shows that the change in the elevation estimate is a function of frequency occurrence. Species at a site with greater frequency occurrence are impacated less by reductions in sampling effort.
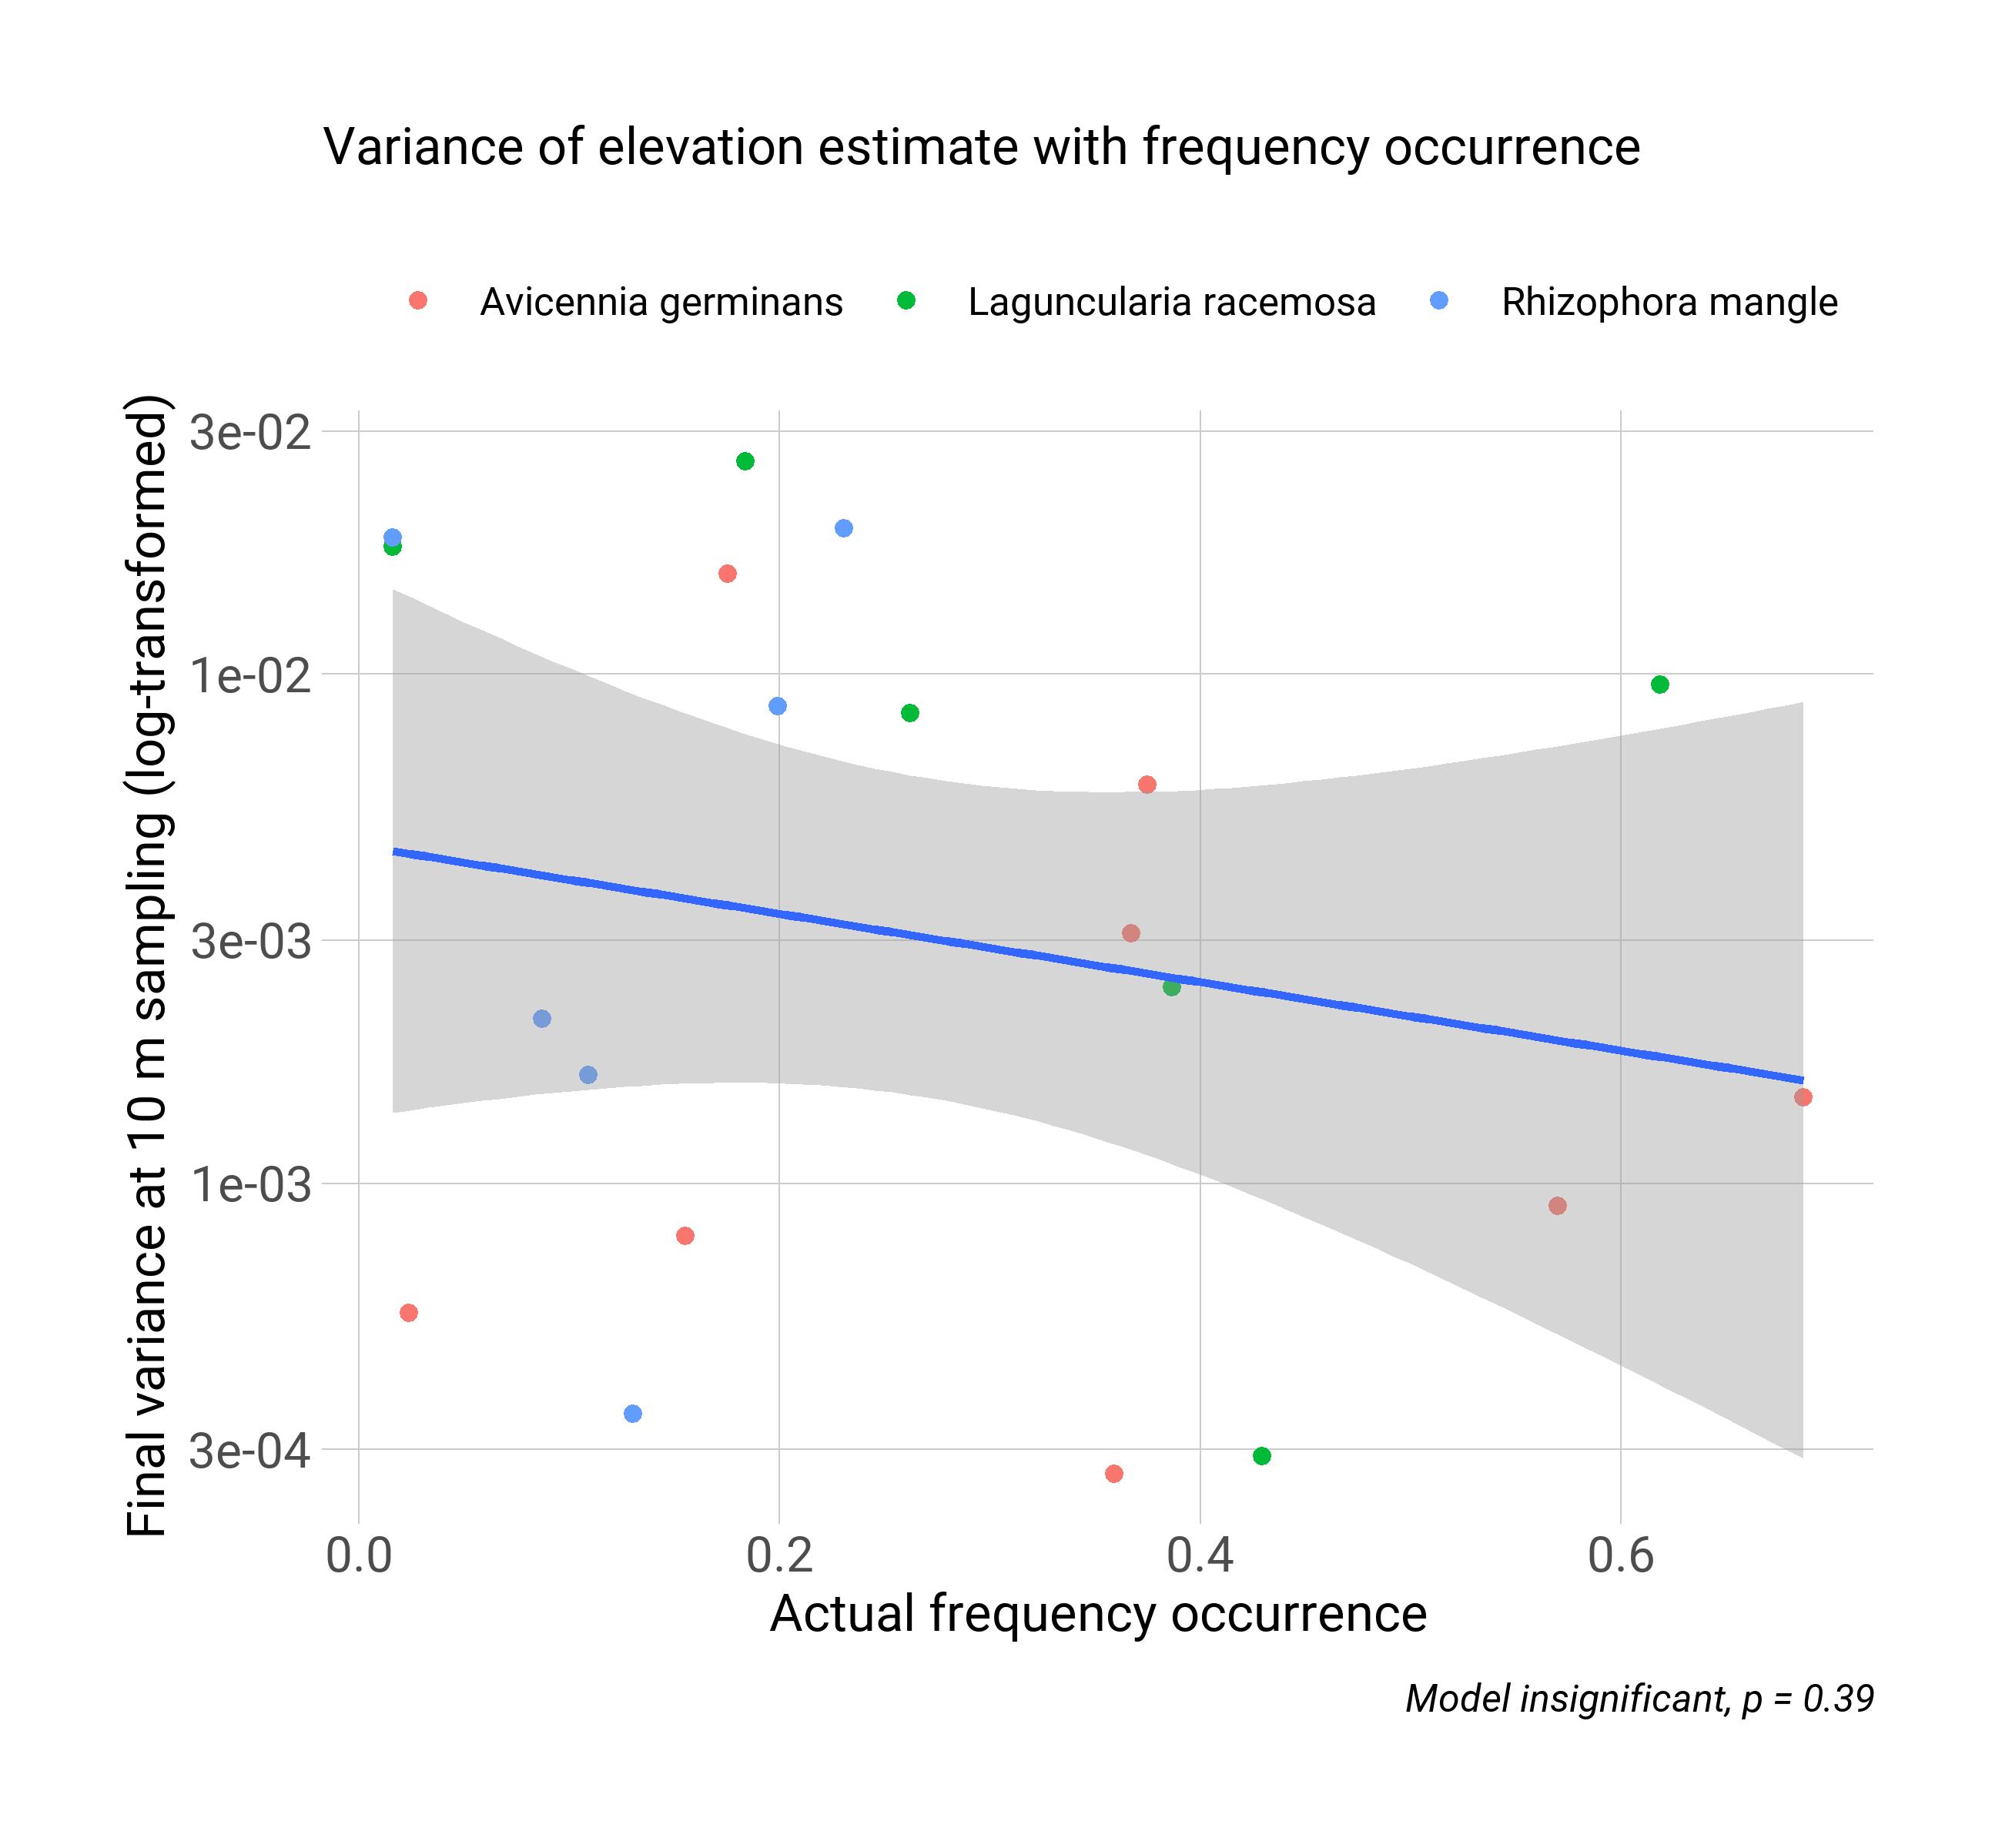
Similar to the above, this plot shows that the variance (or certainty) in the elevation estimate is a function of frequency occurrence. Elevation estimates are more precise for species at a site with greater frequency occurrence.