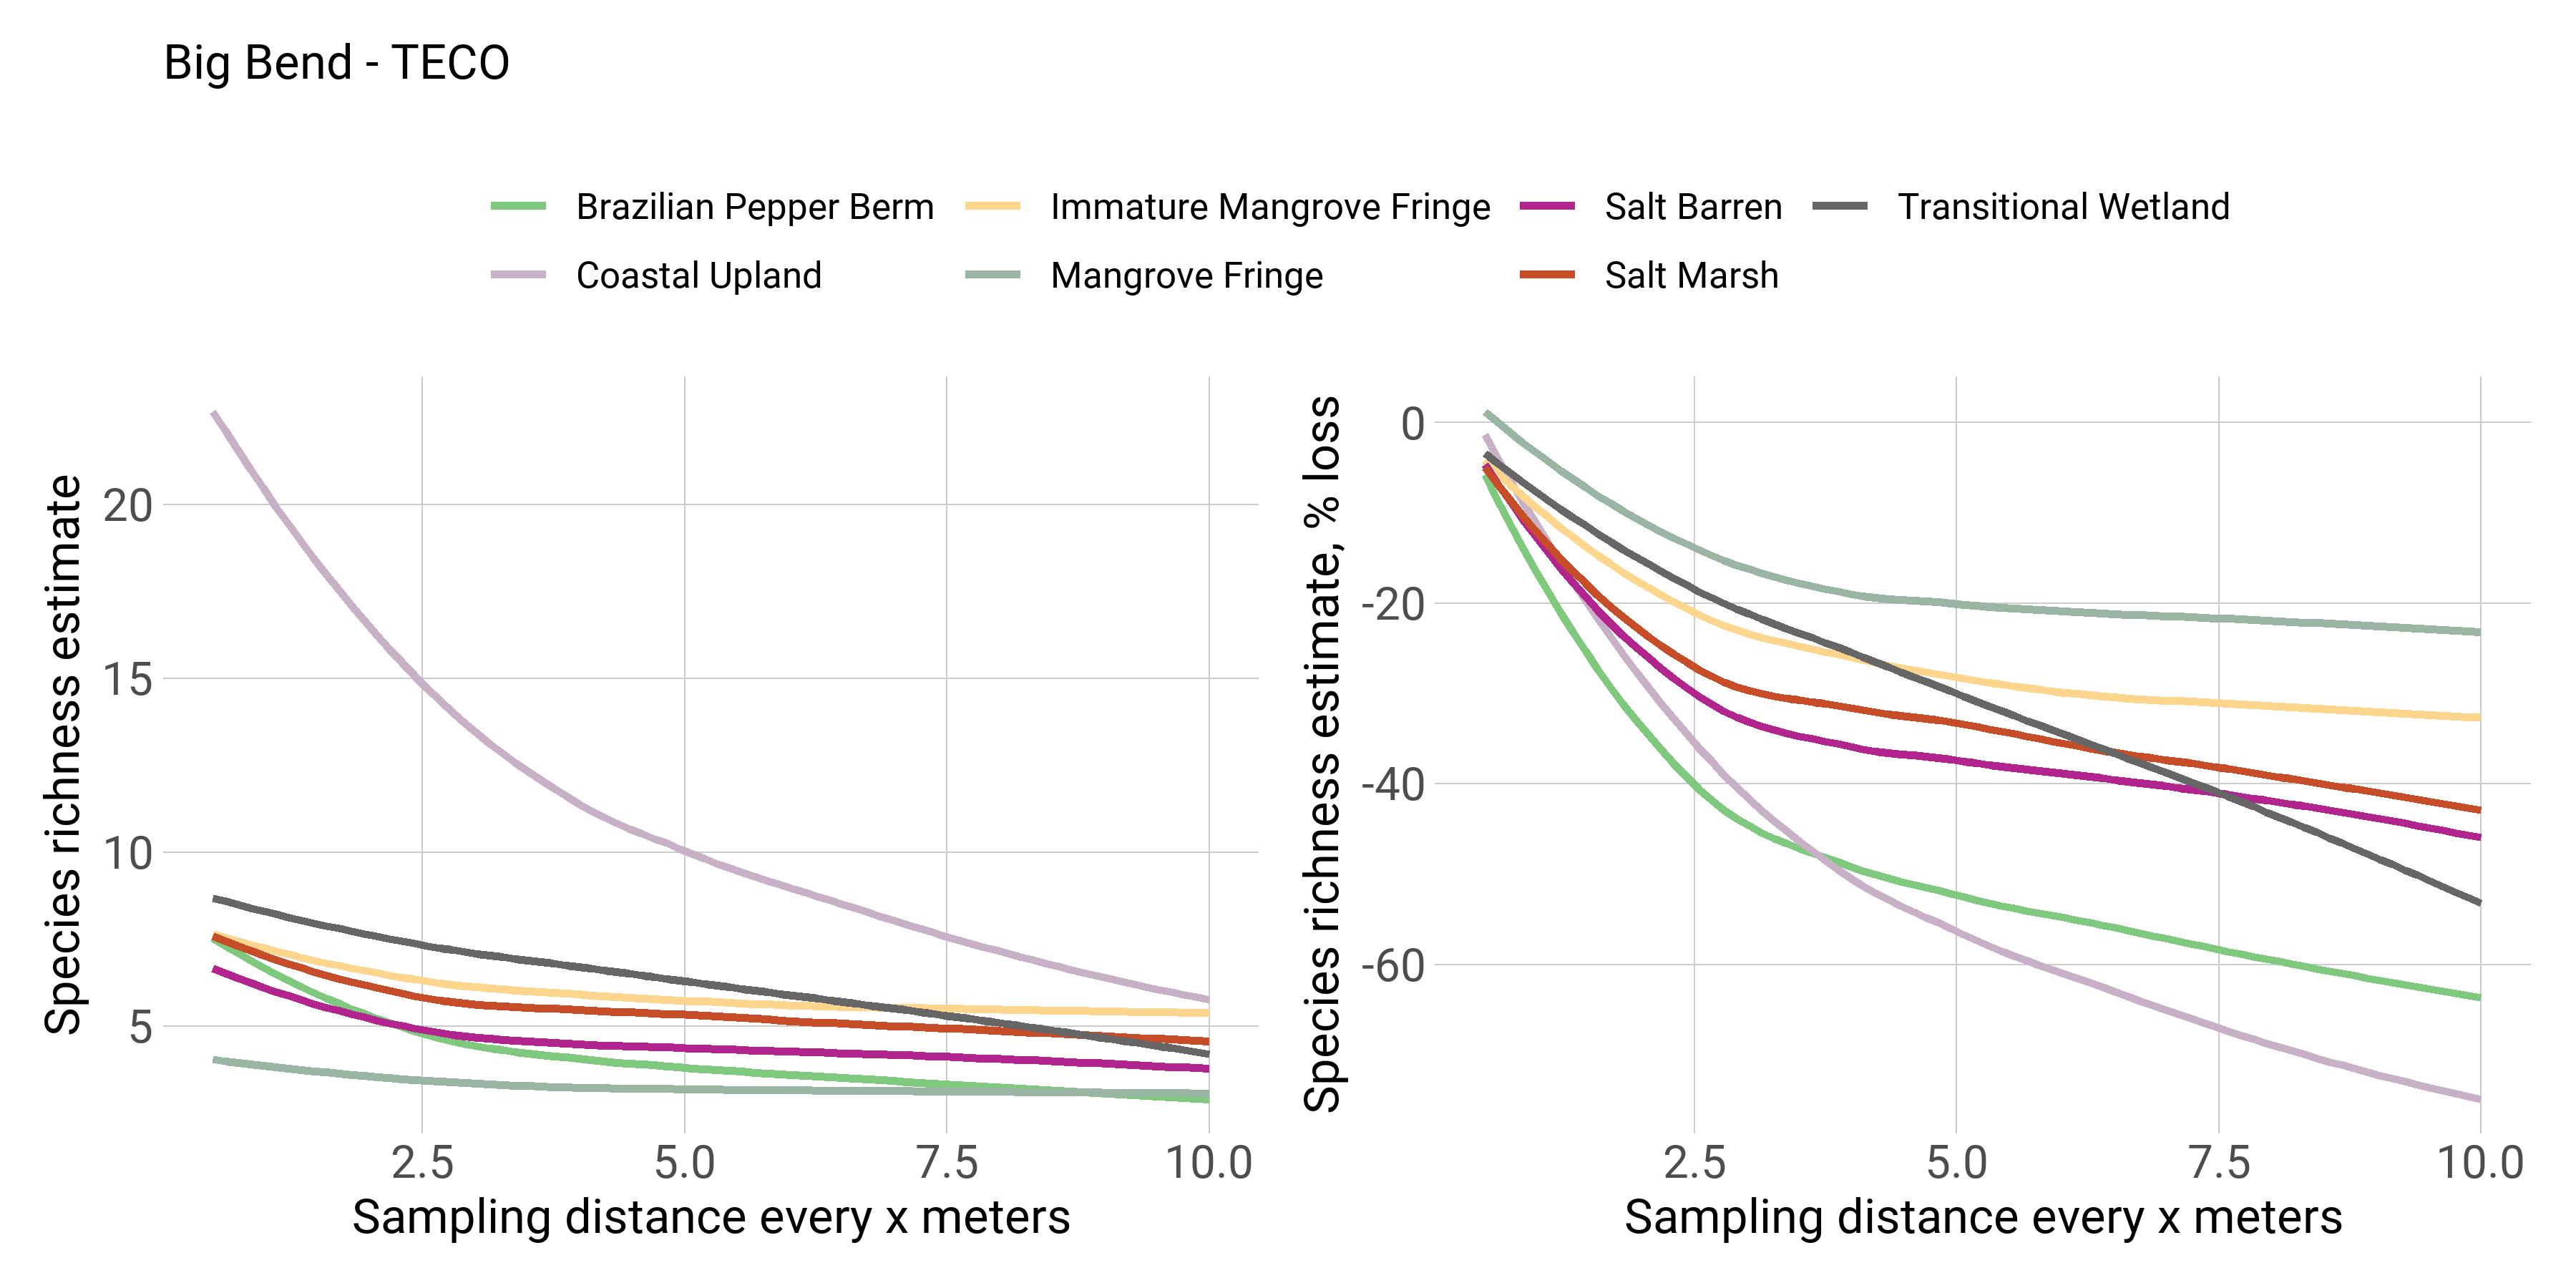
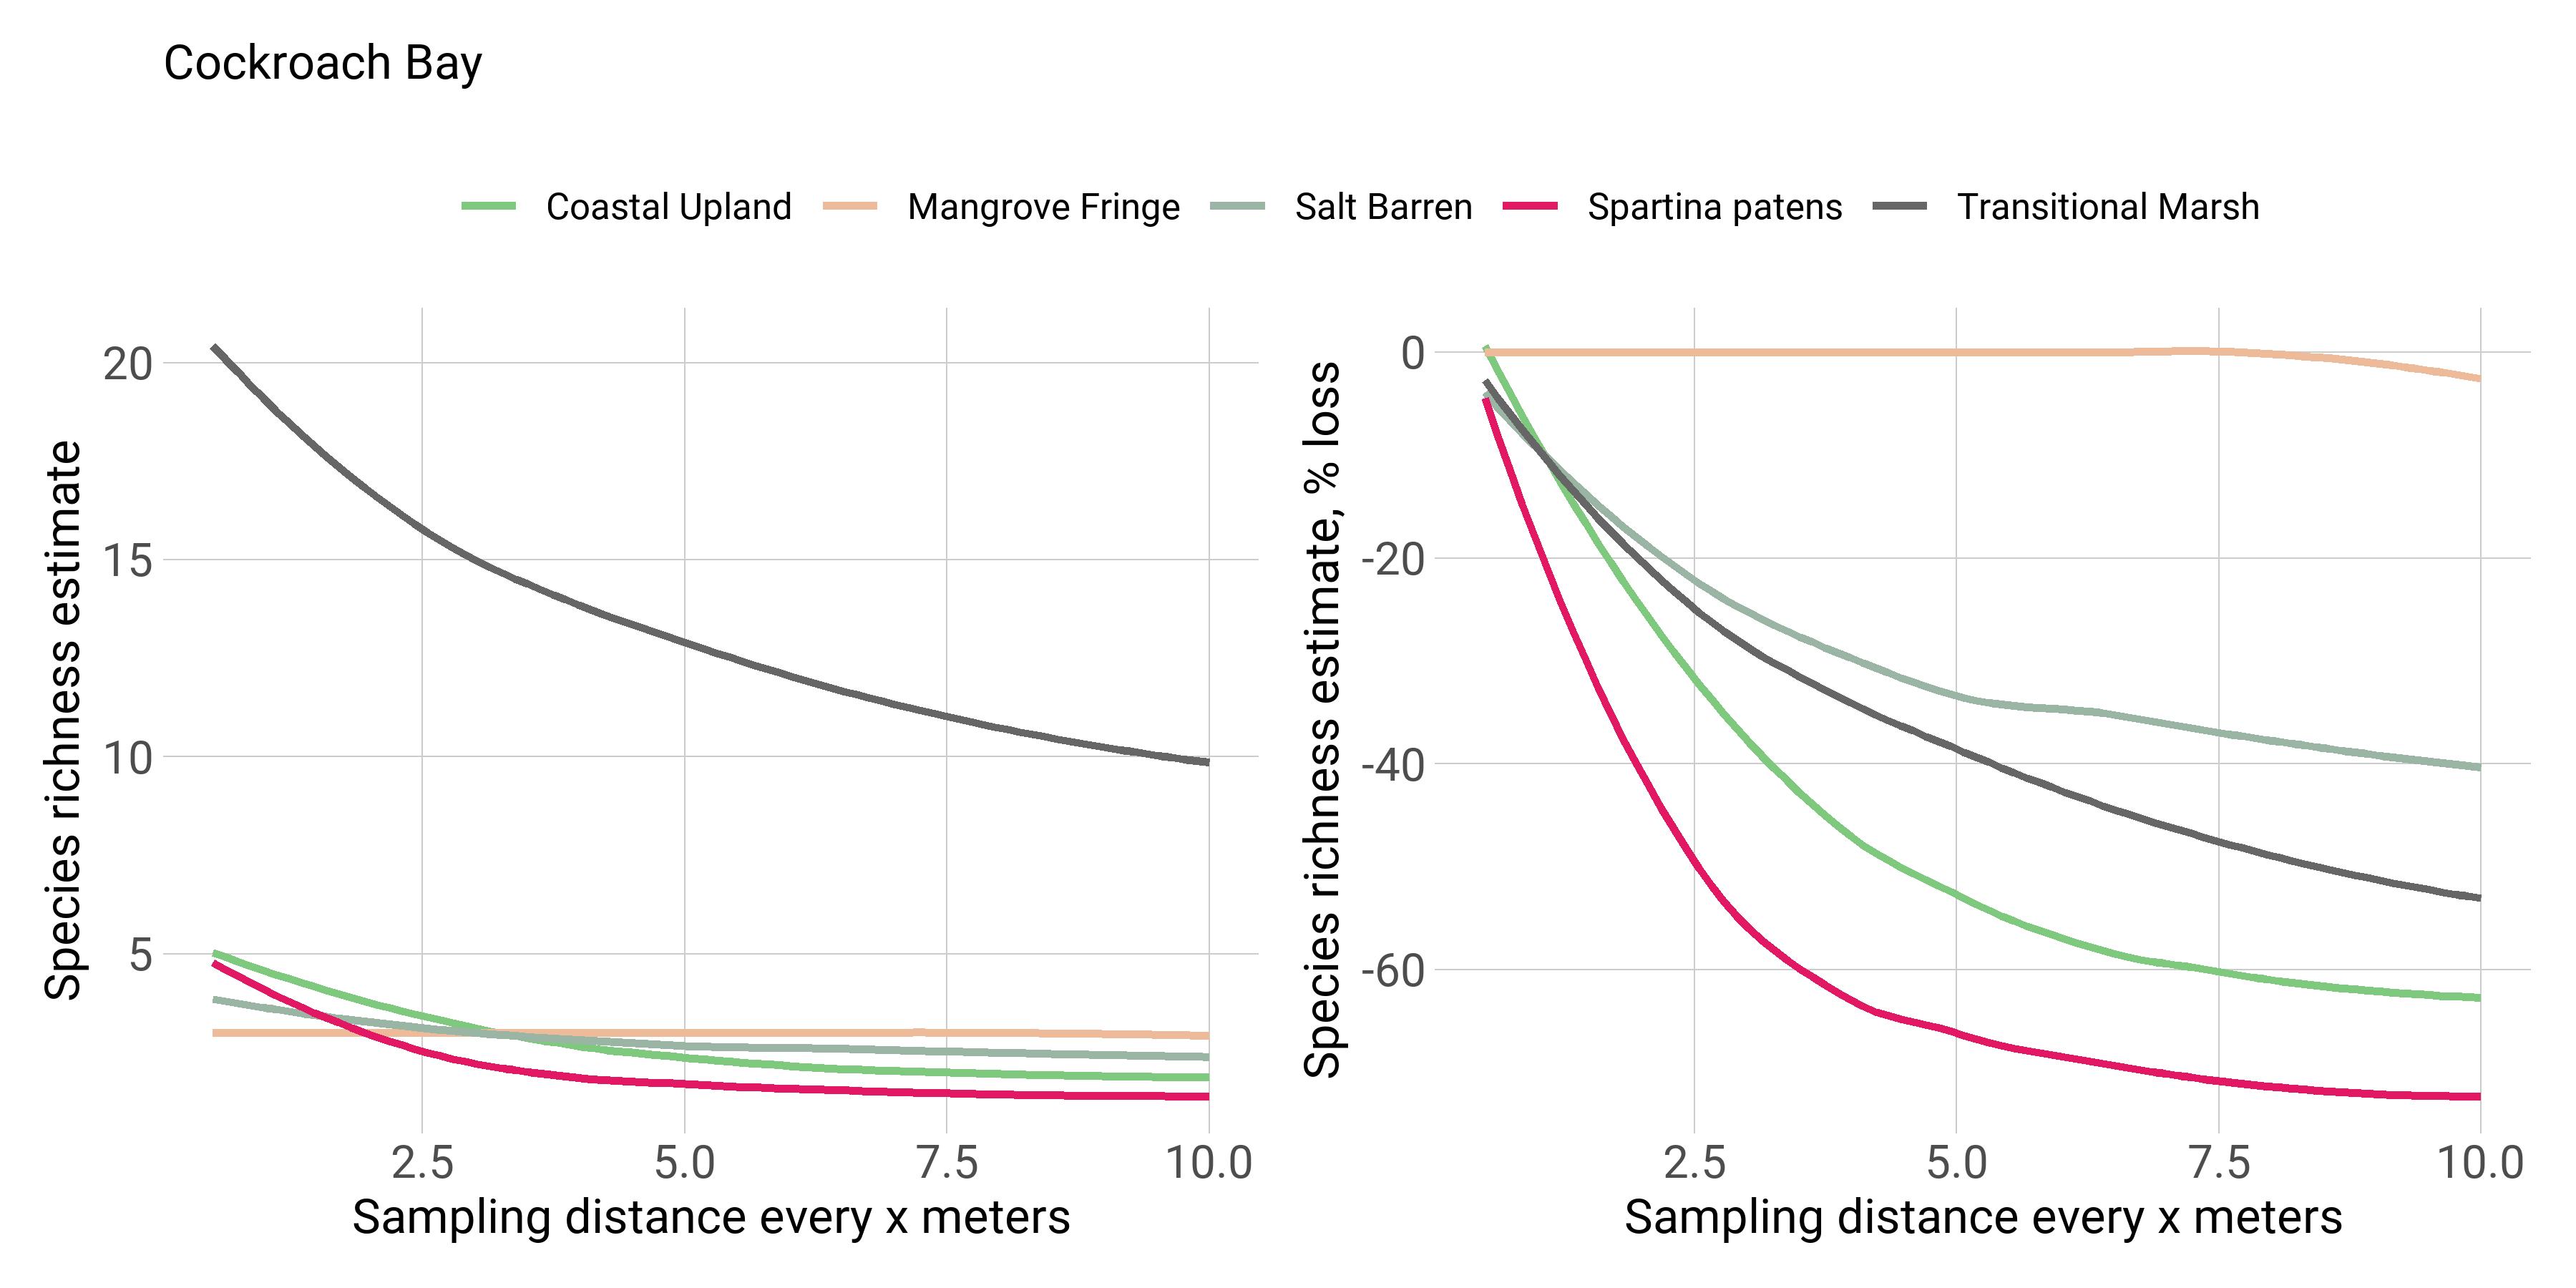
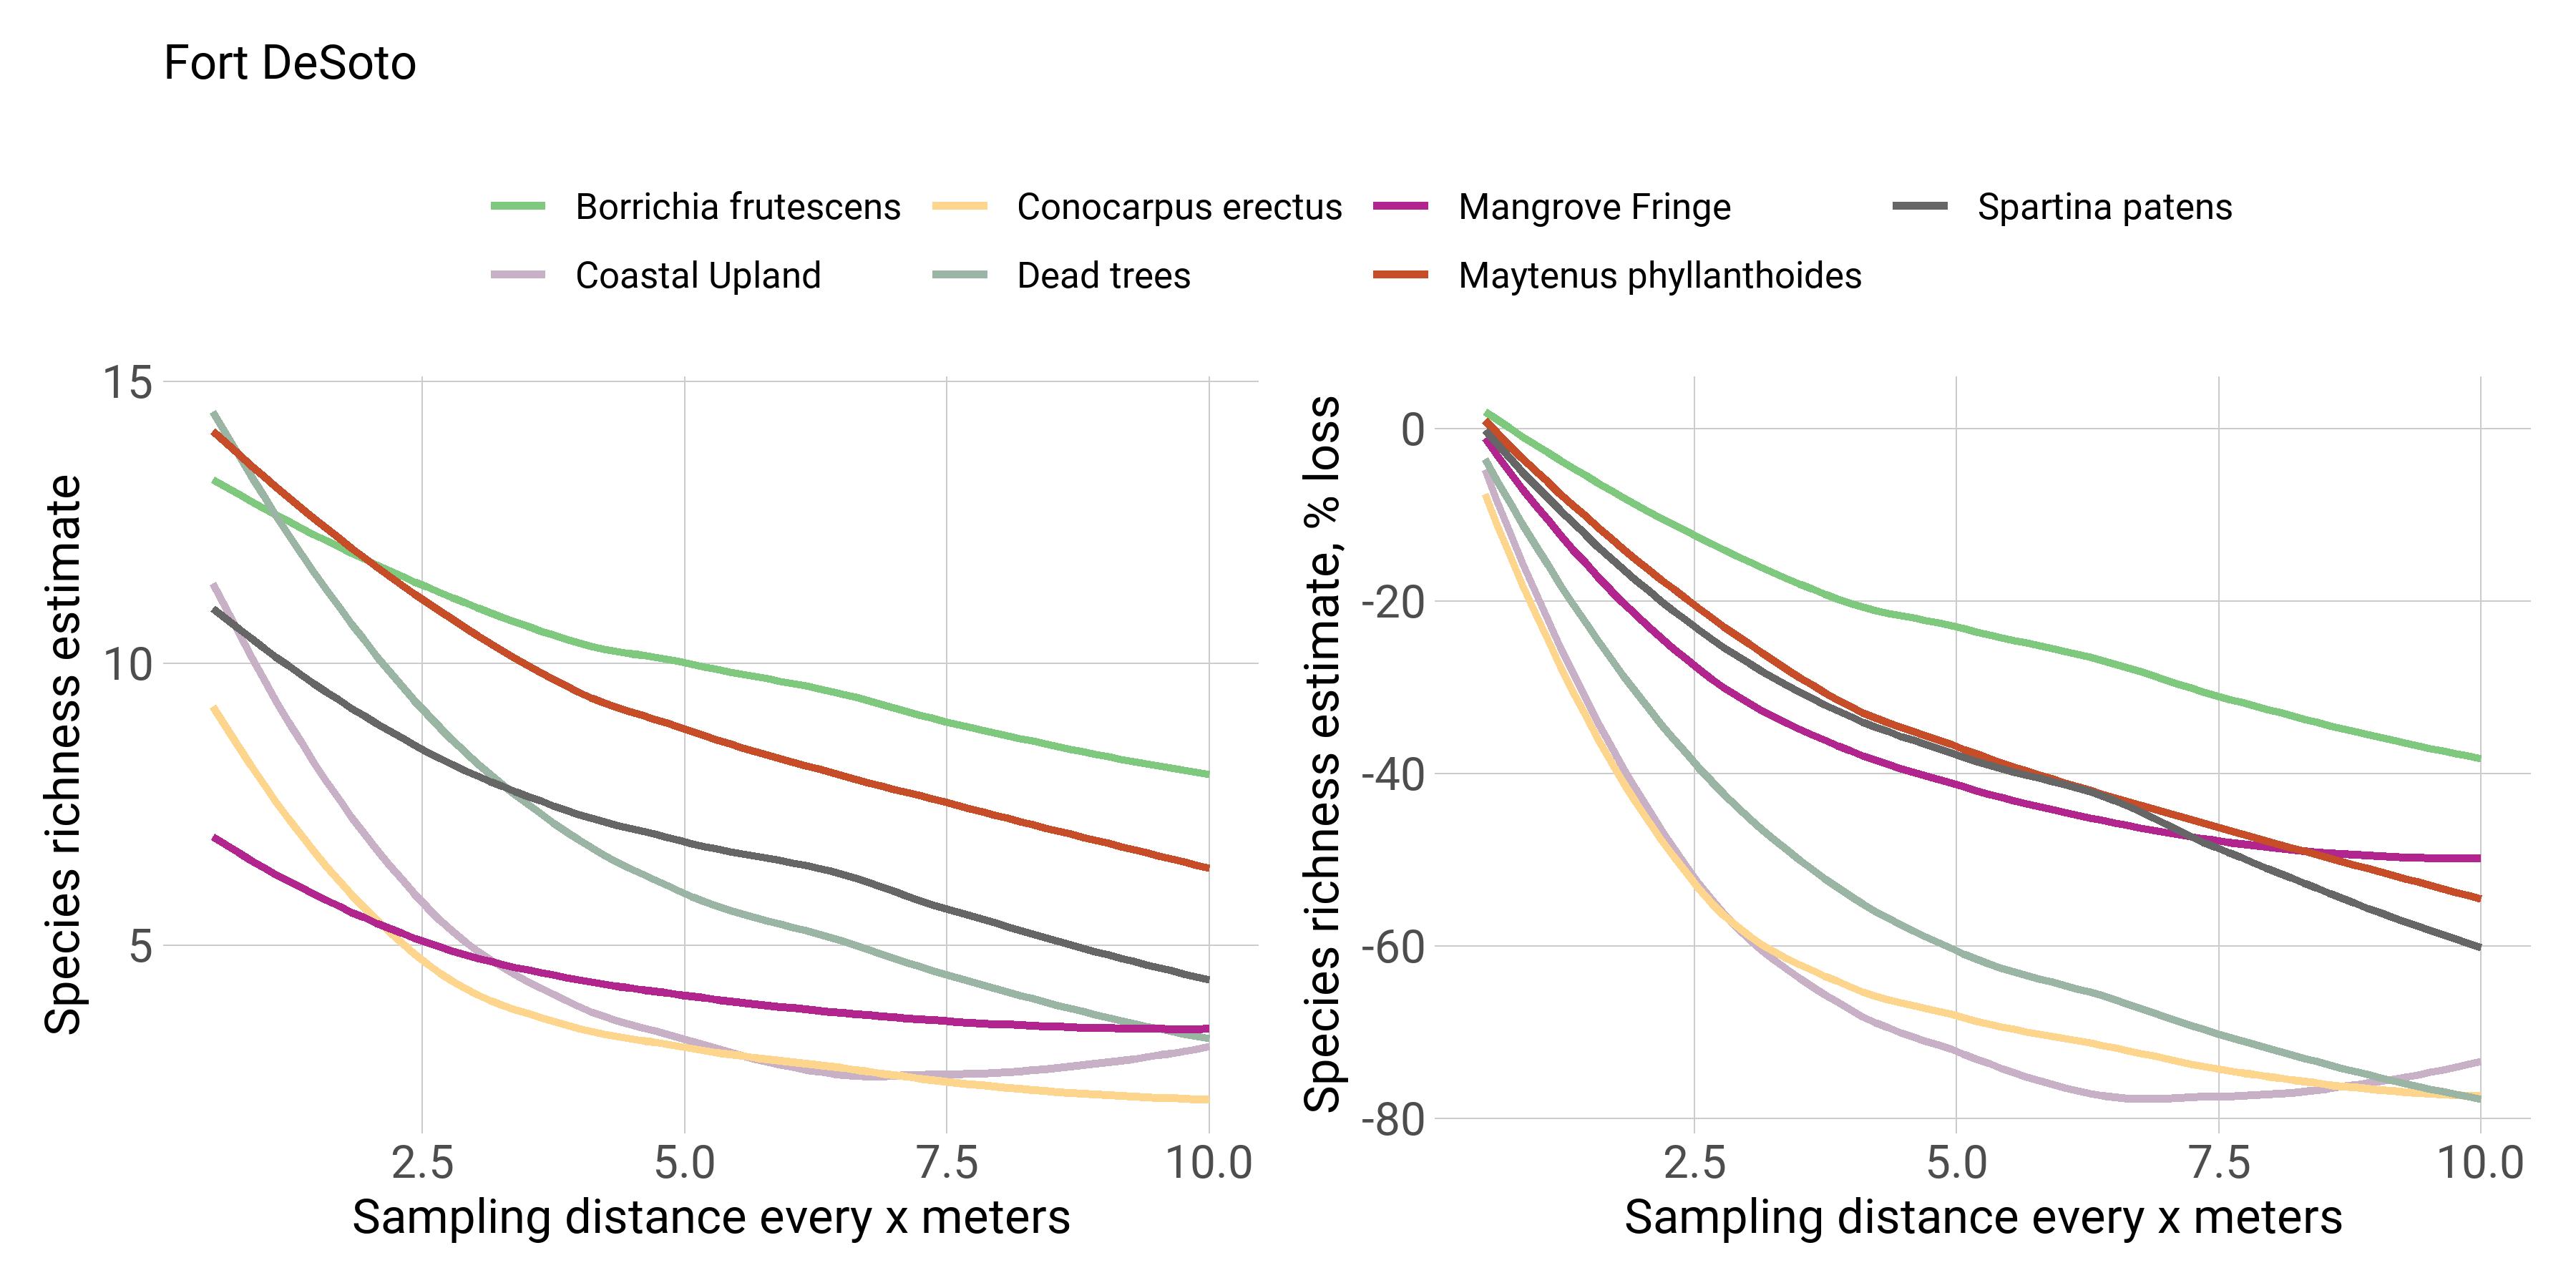
Richness by zone
These plots show richness estimates for zones at each site with a reduction of sampling effort. The lines show the estimated reduction for each zone, with the left plot showing absolute reduction and the right plot showing percent reduction. Species richness at a zone is based on the combined counts from both rounds of sampling (baseline and 2018).
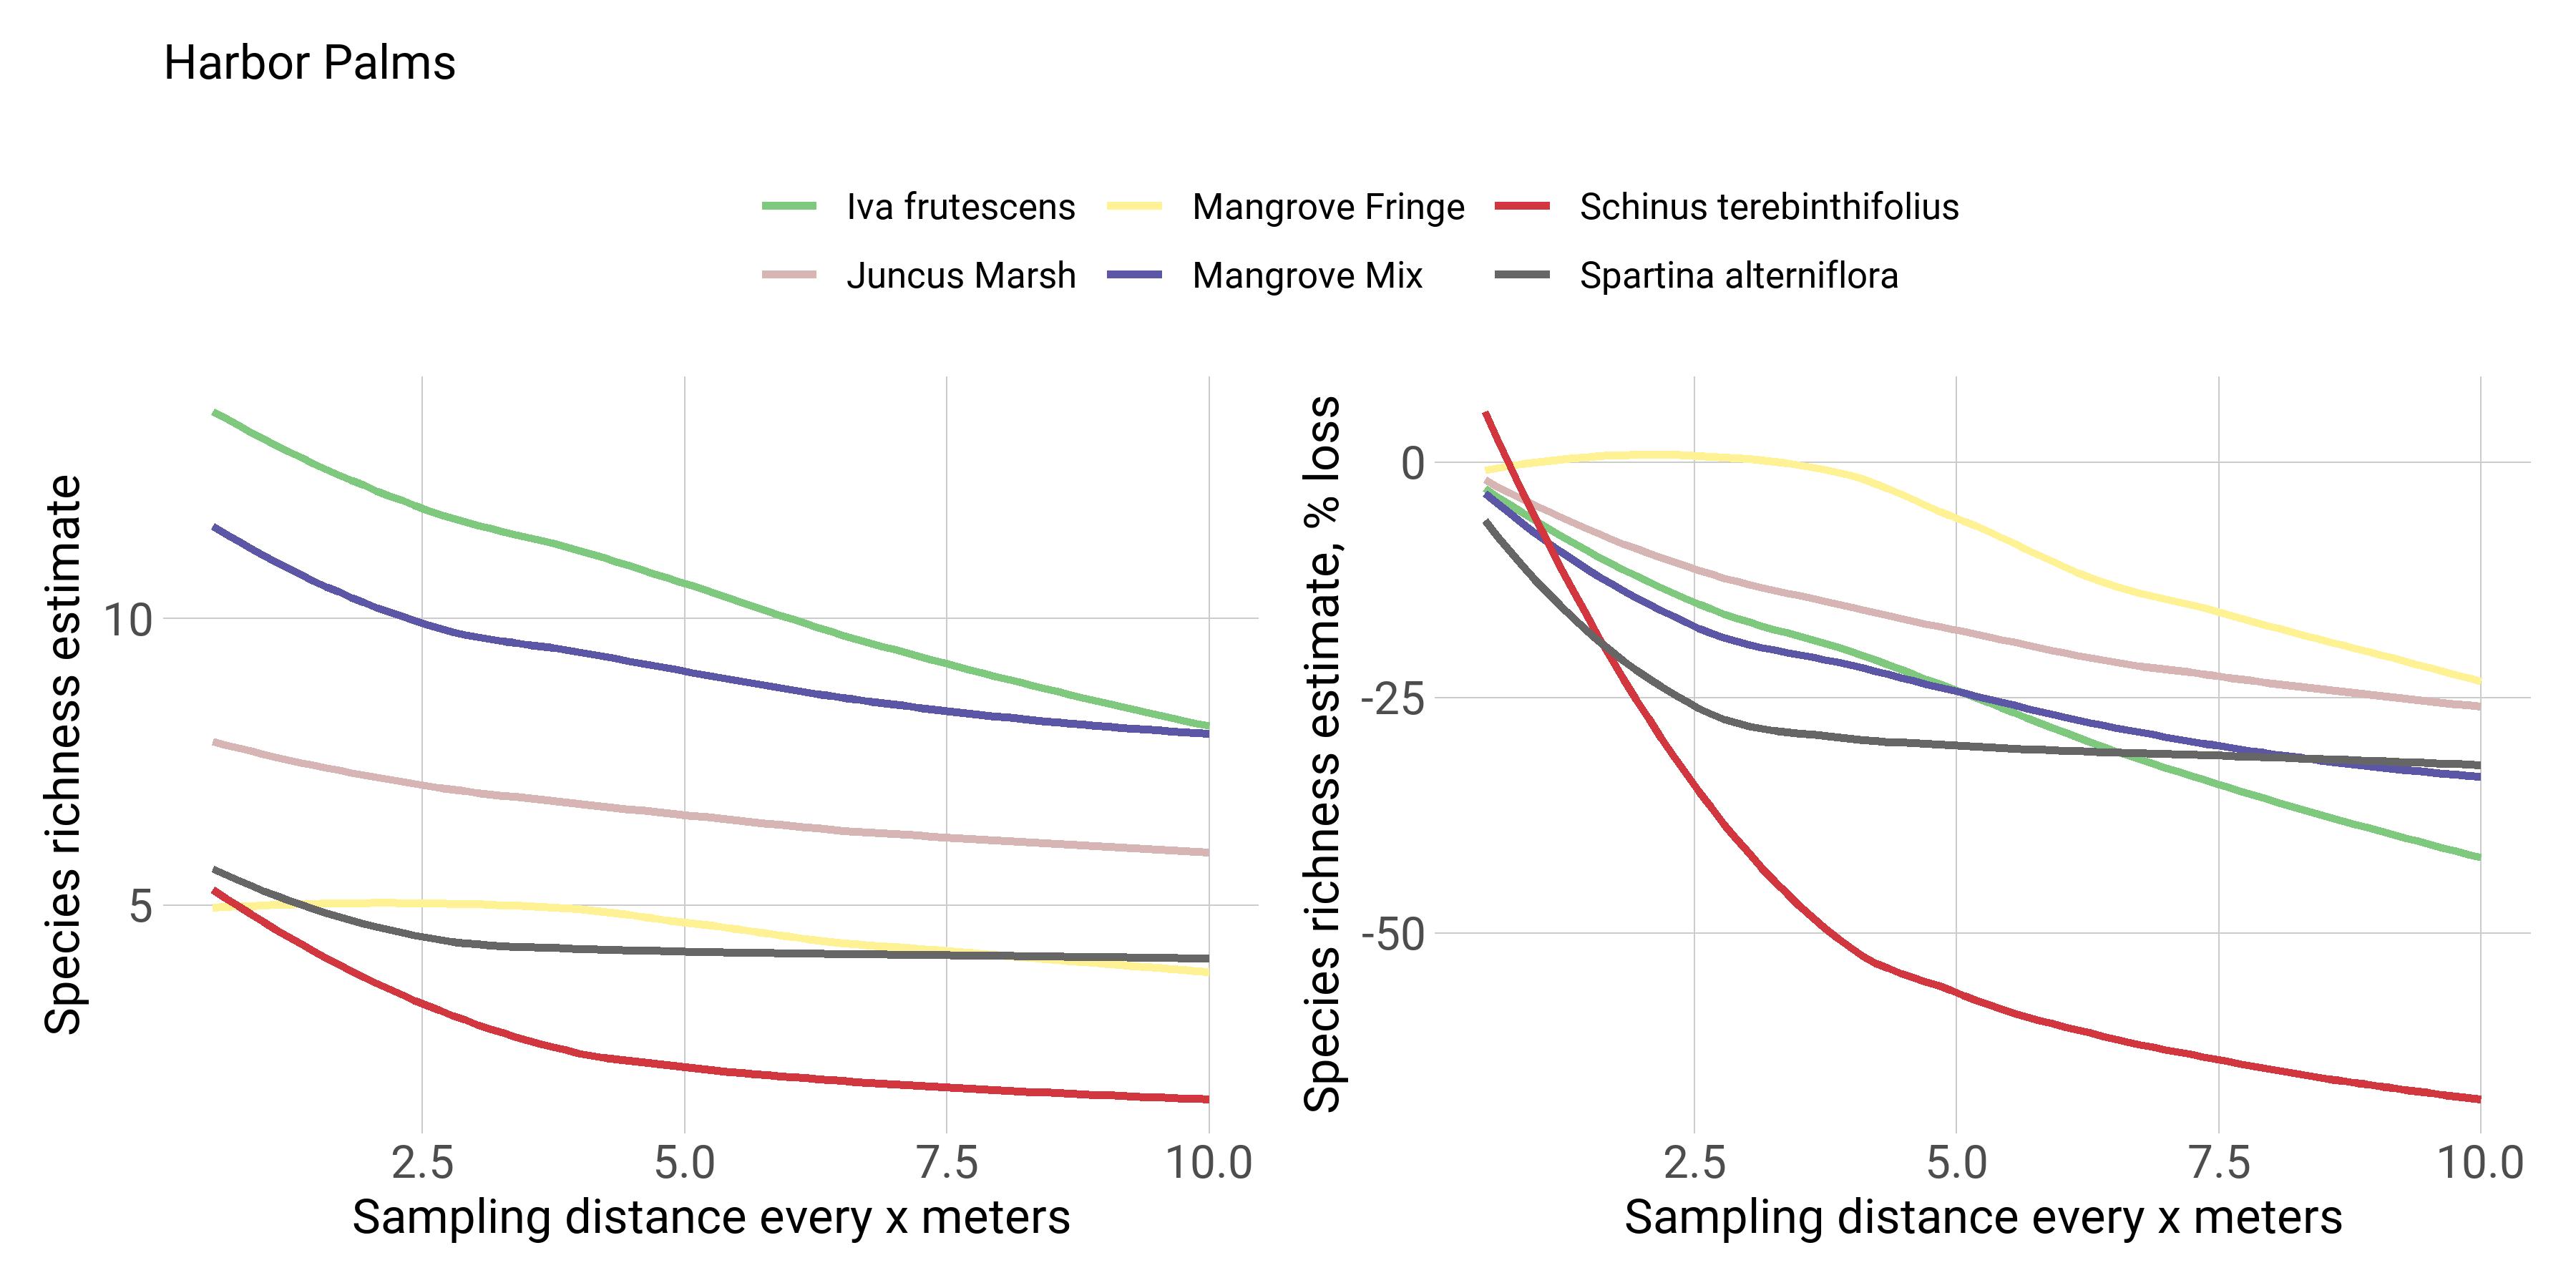
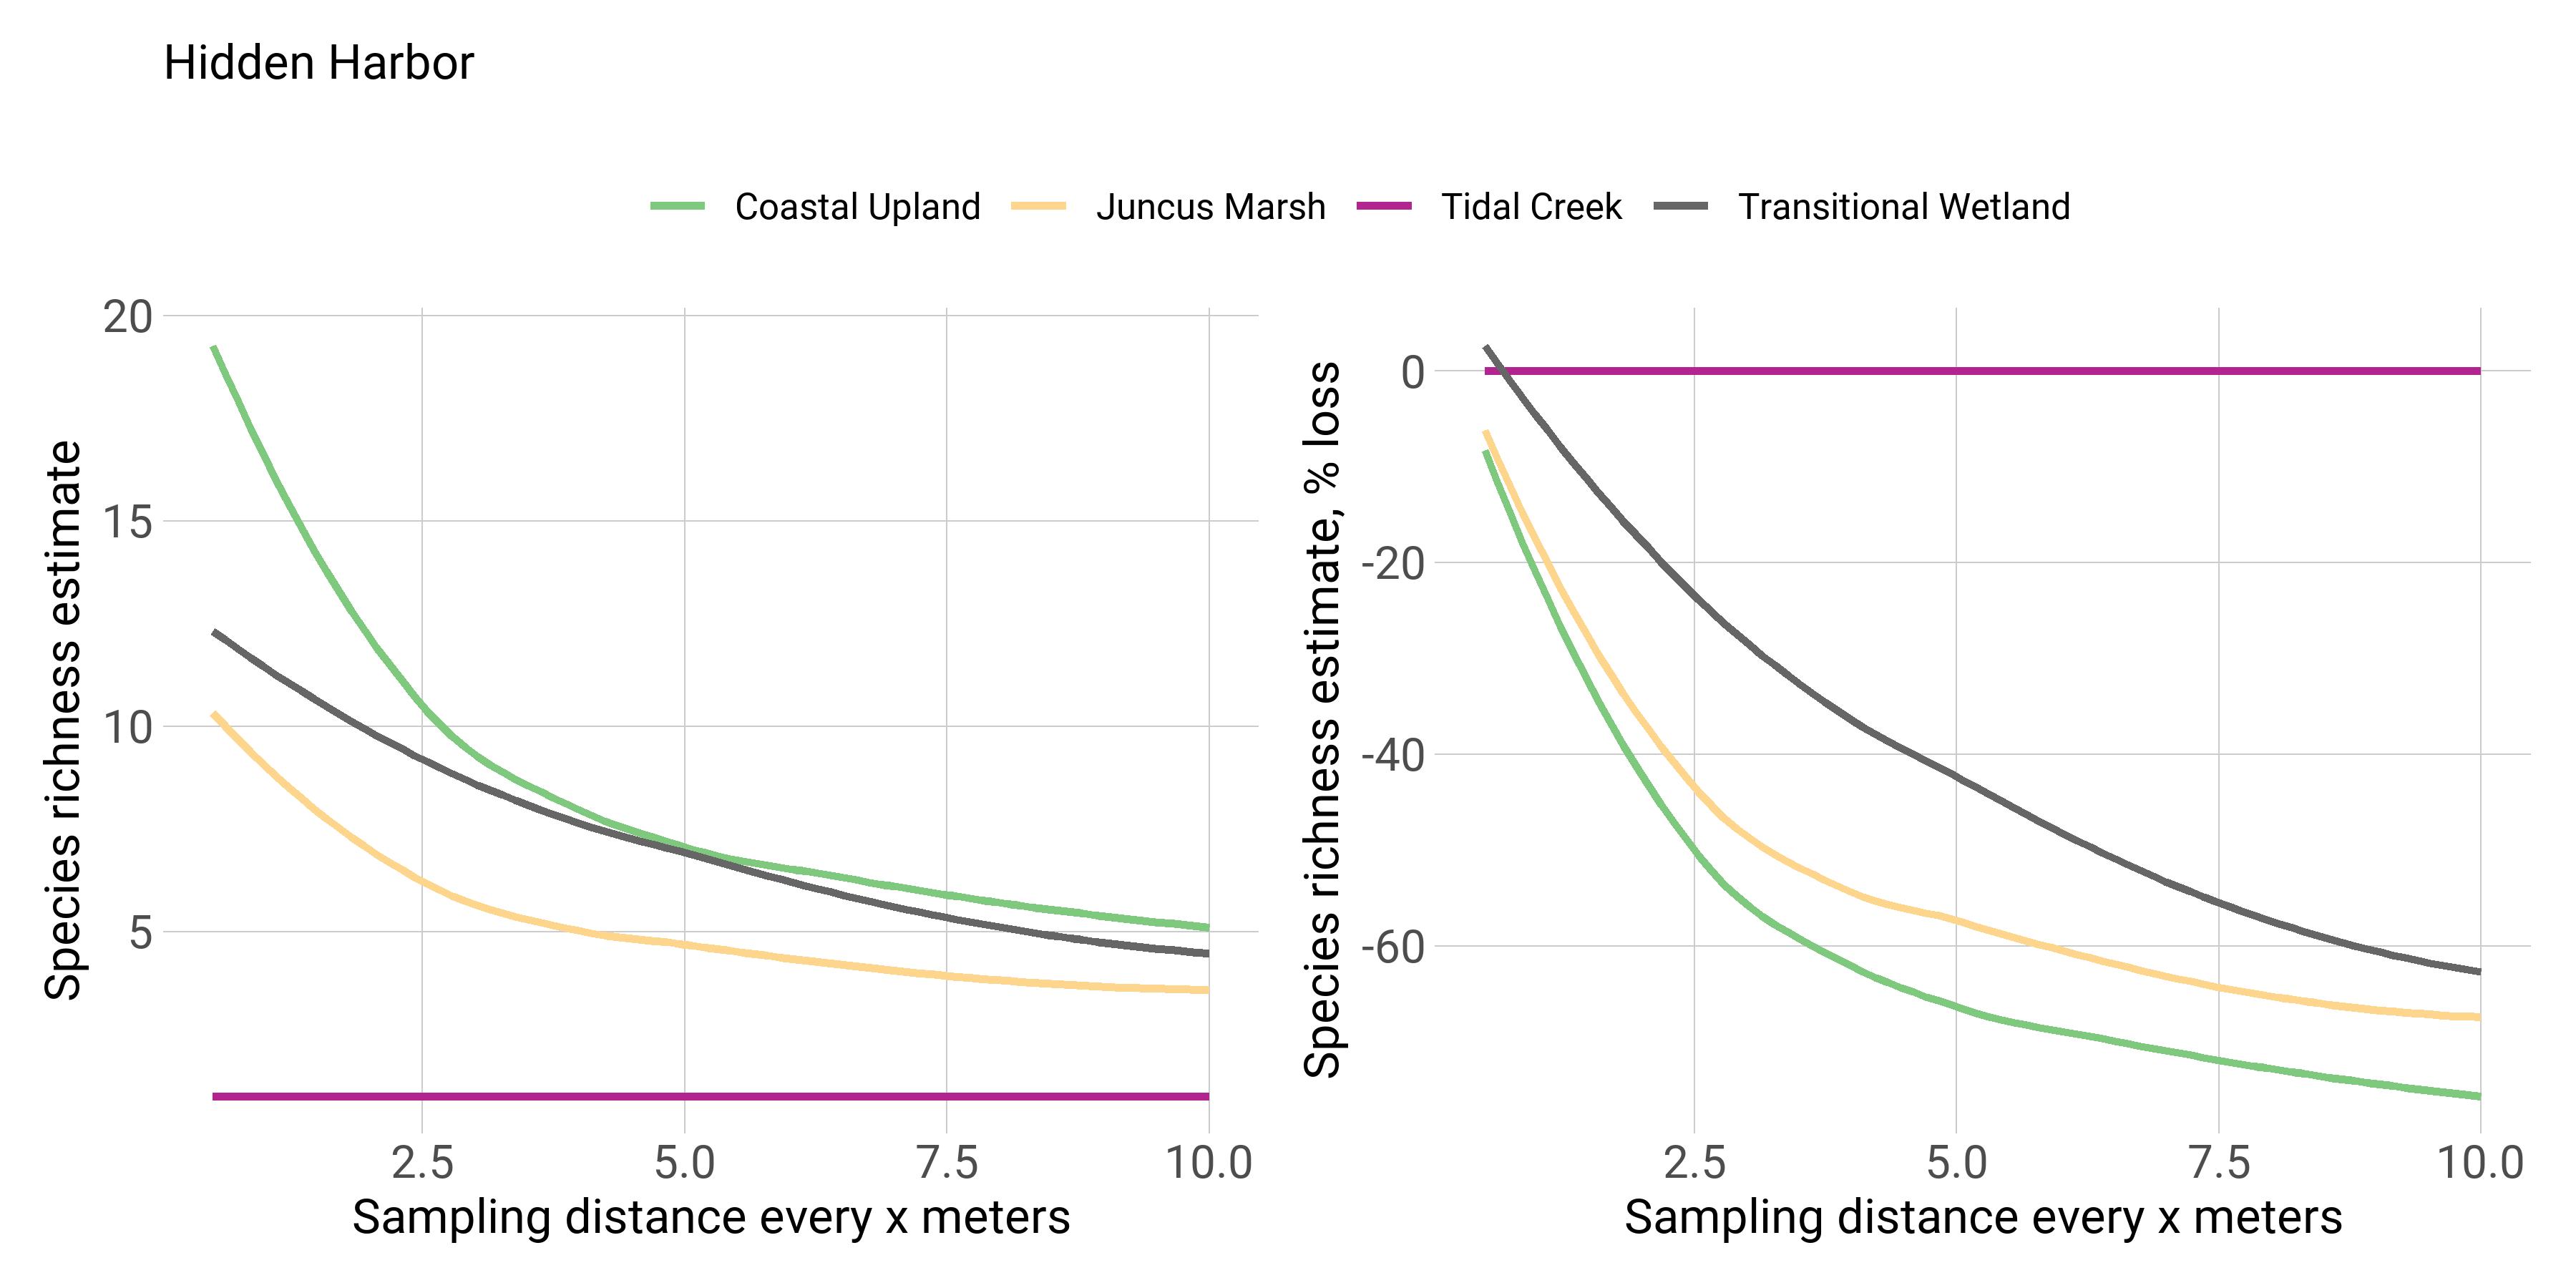
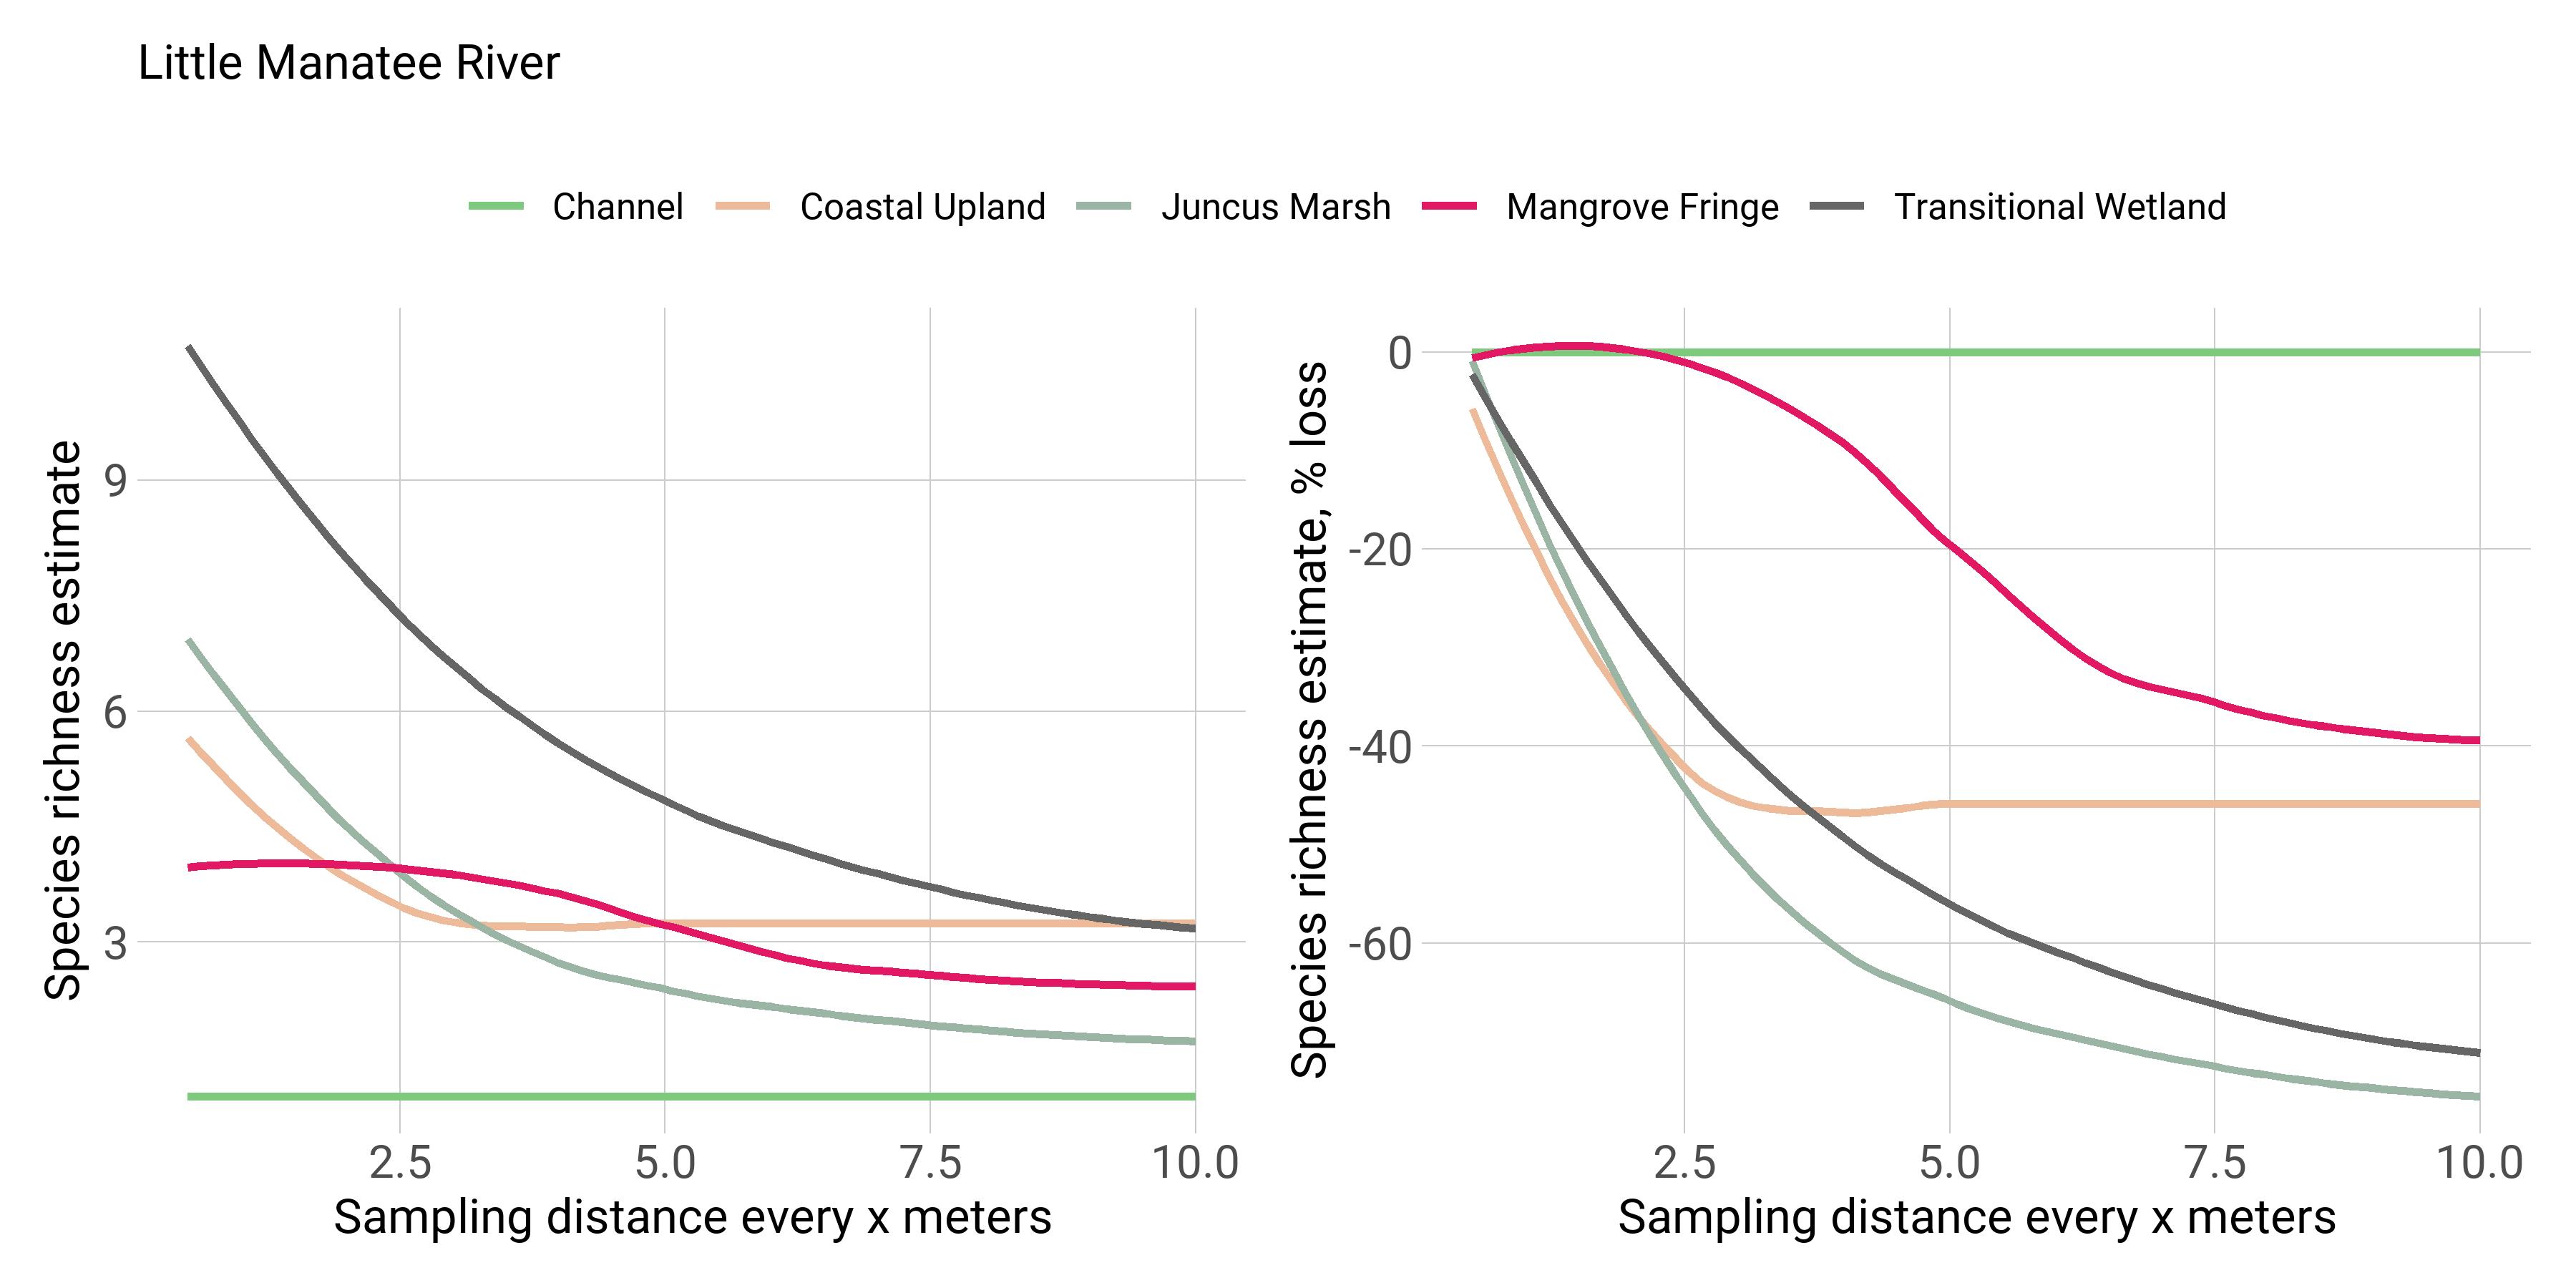
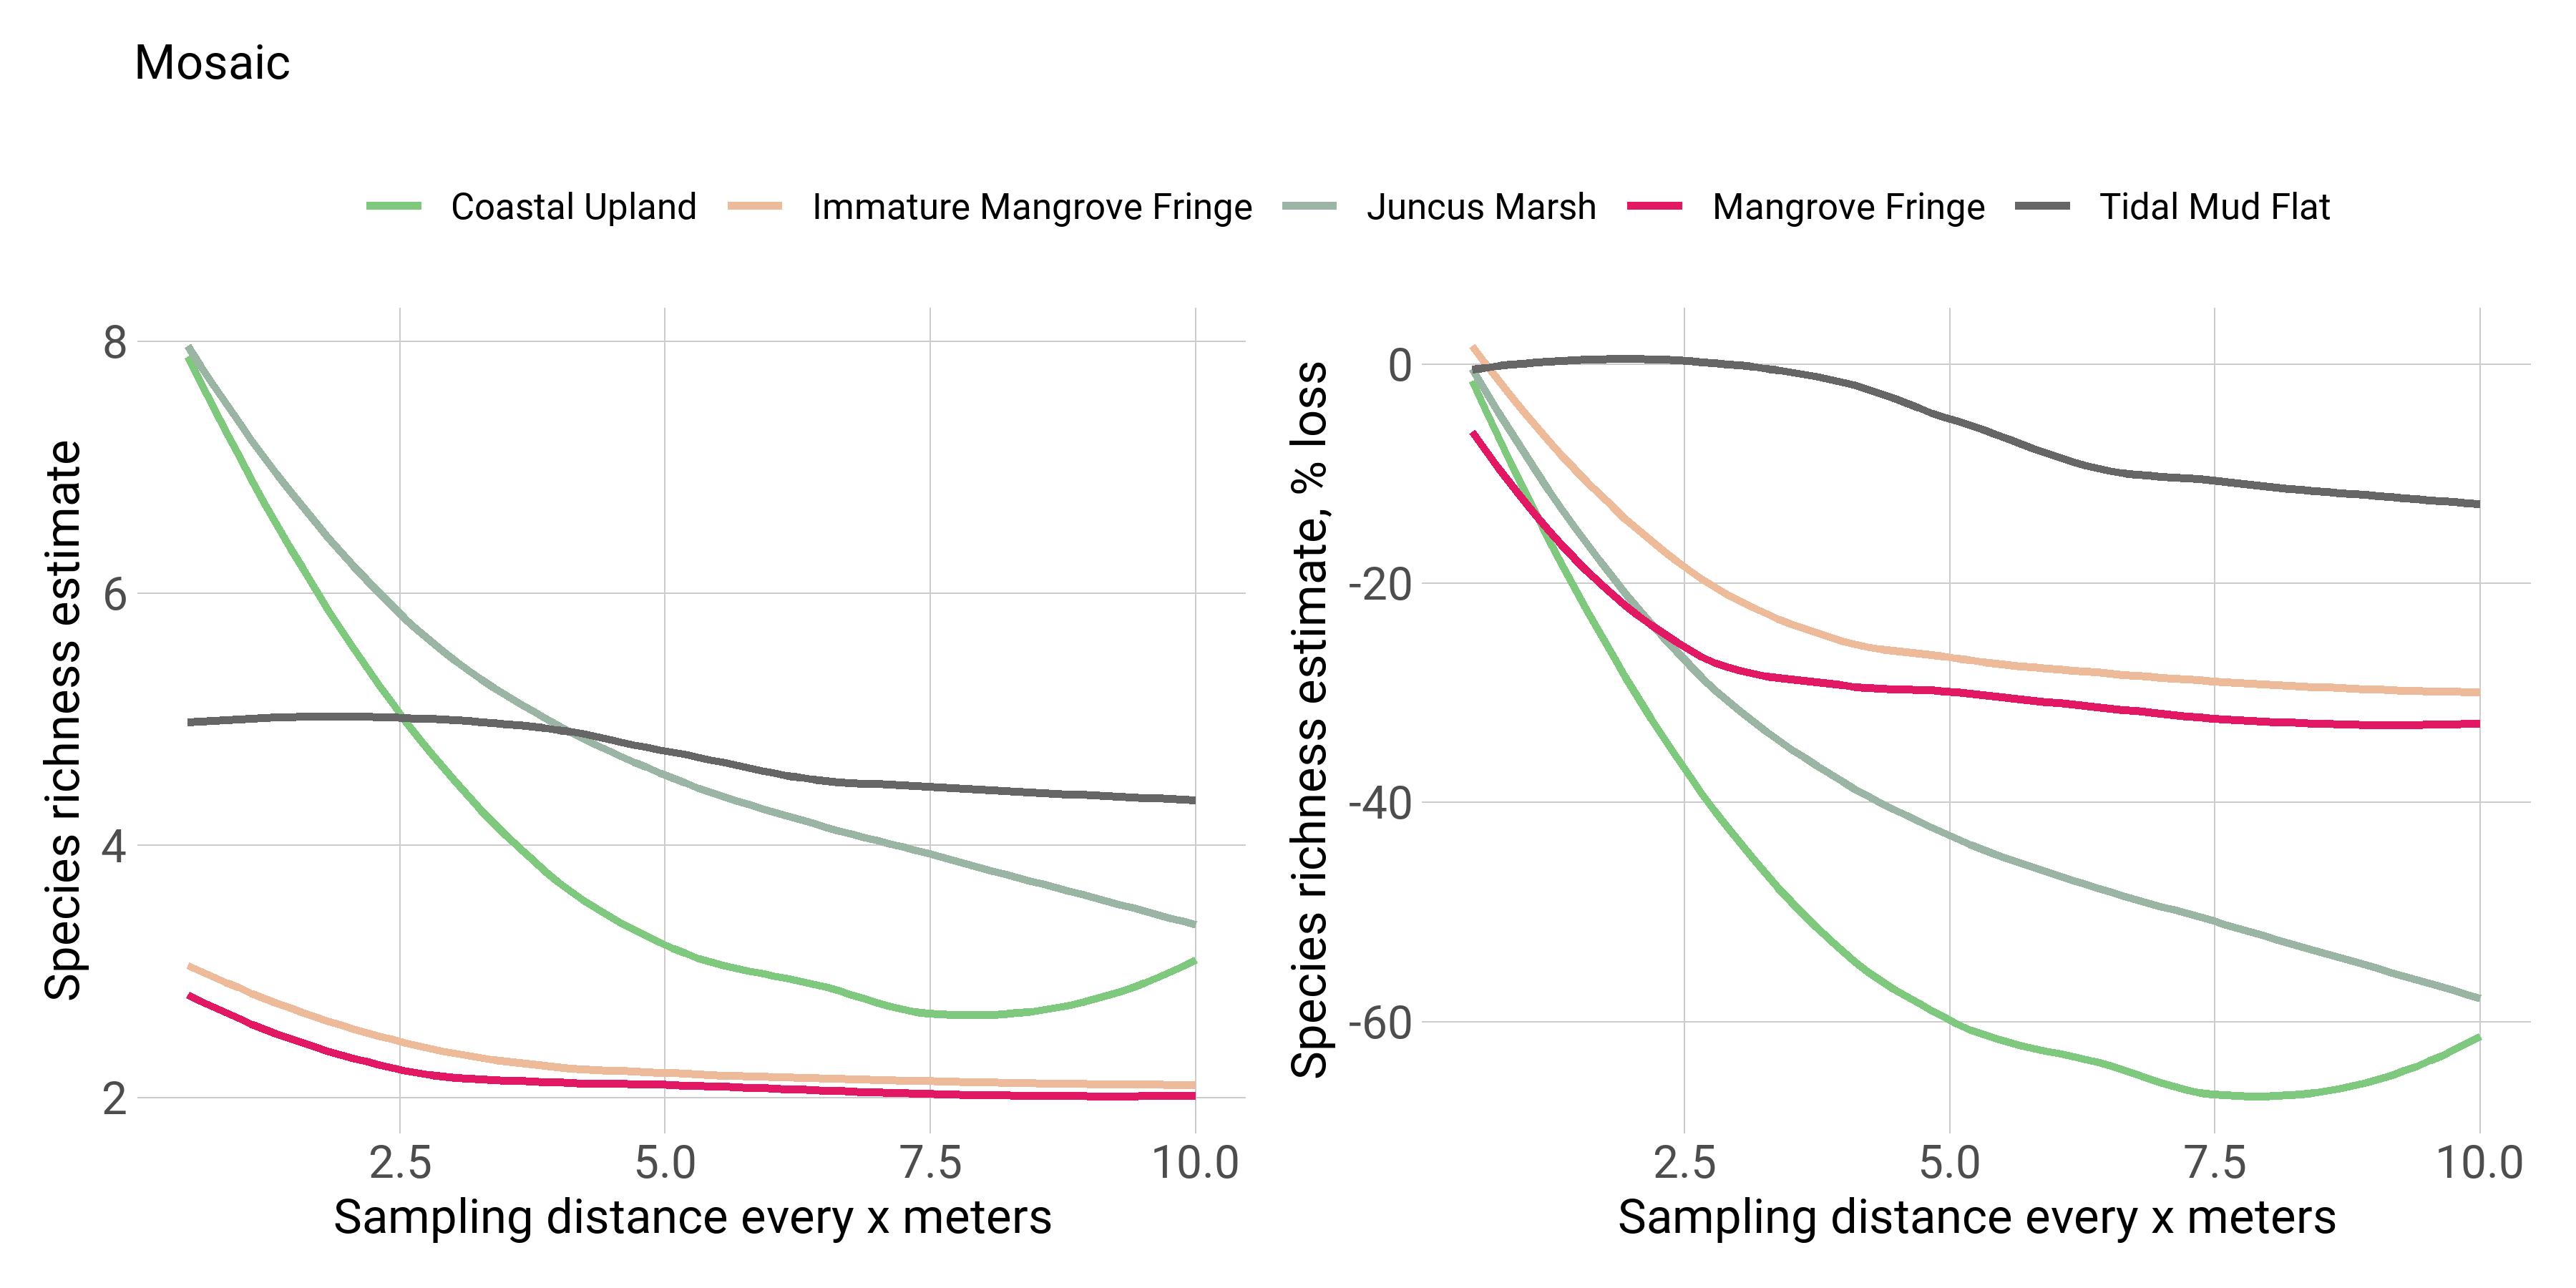
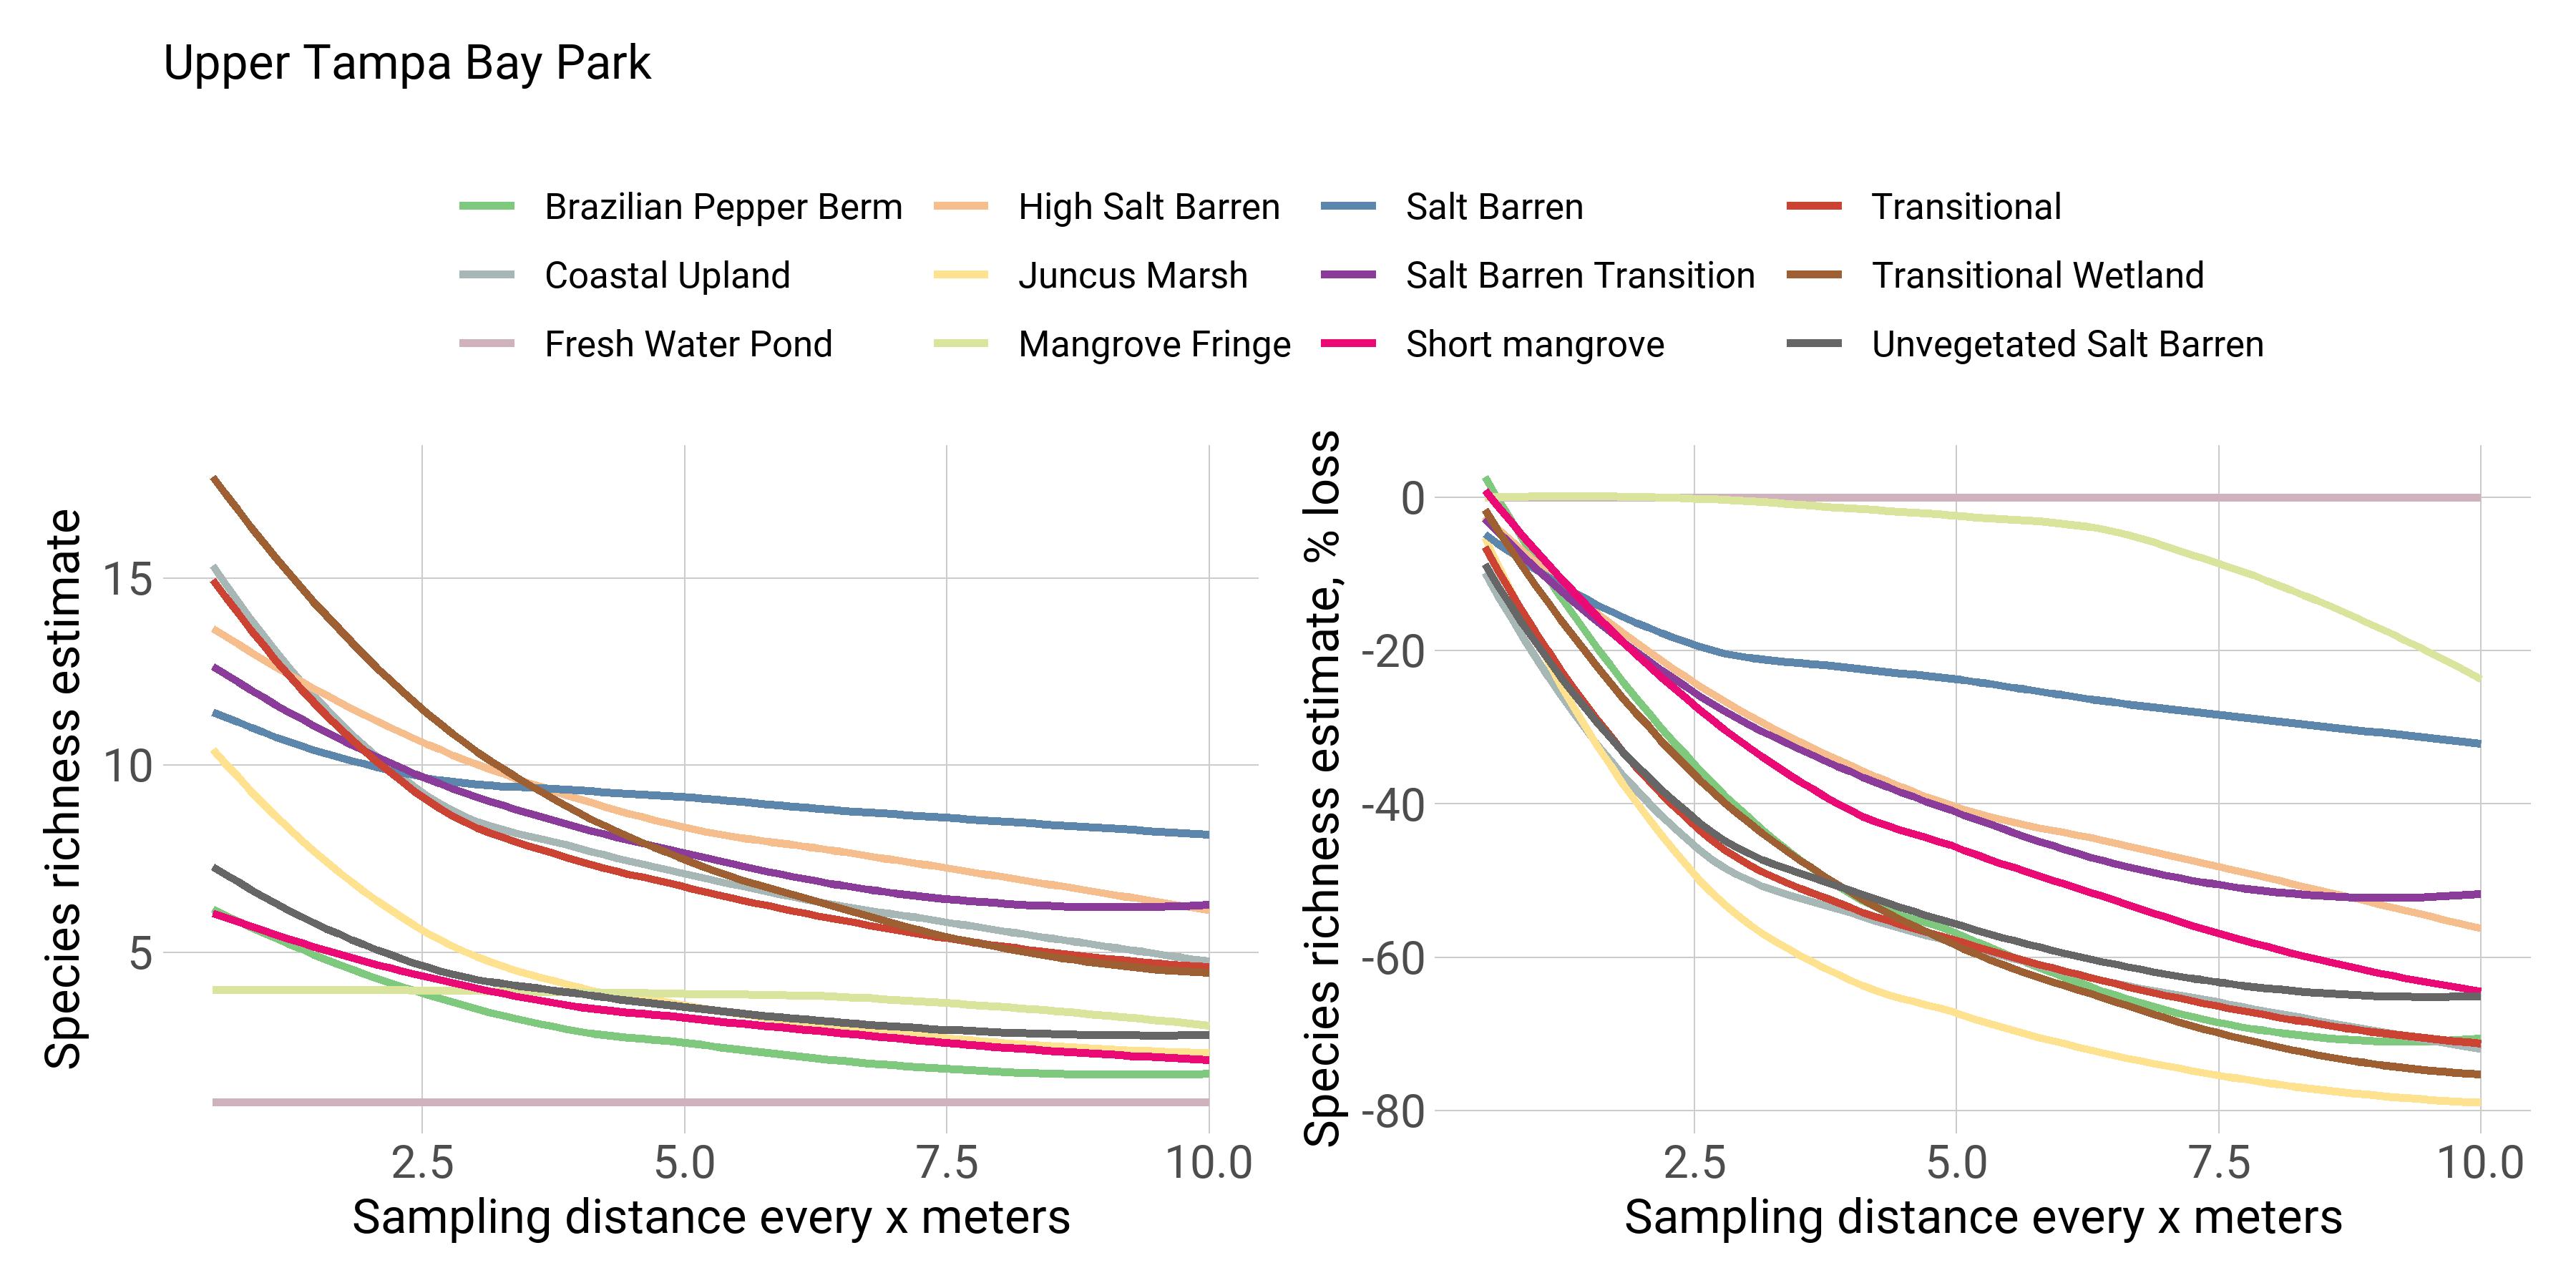
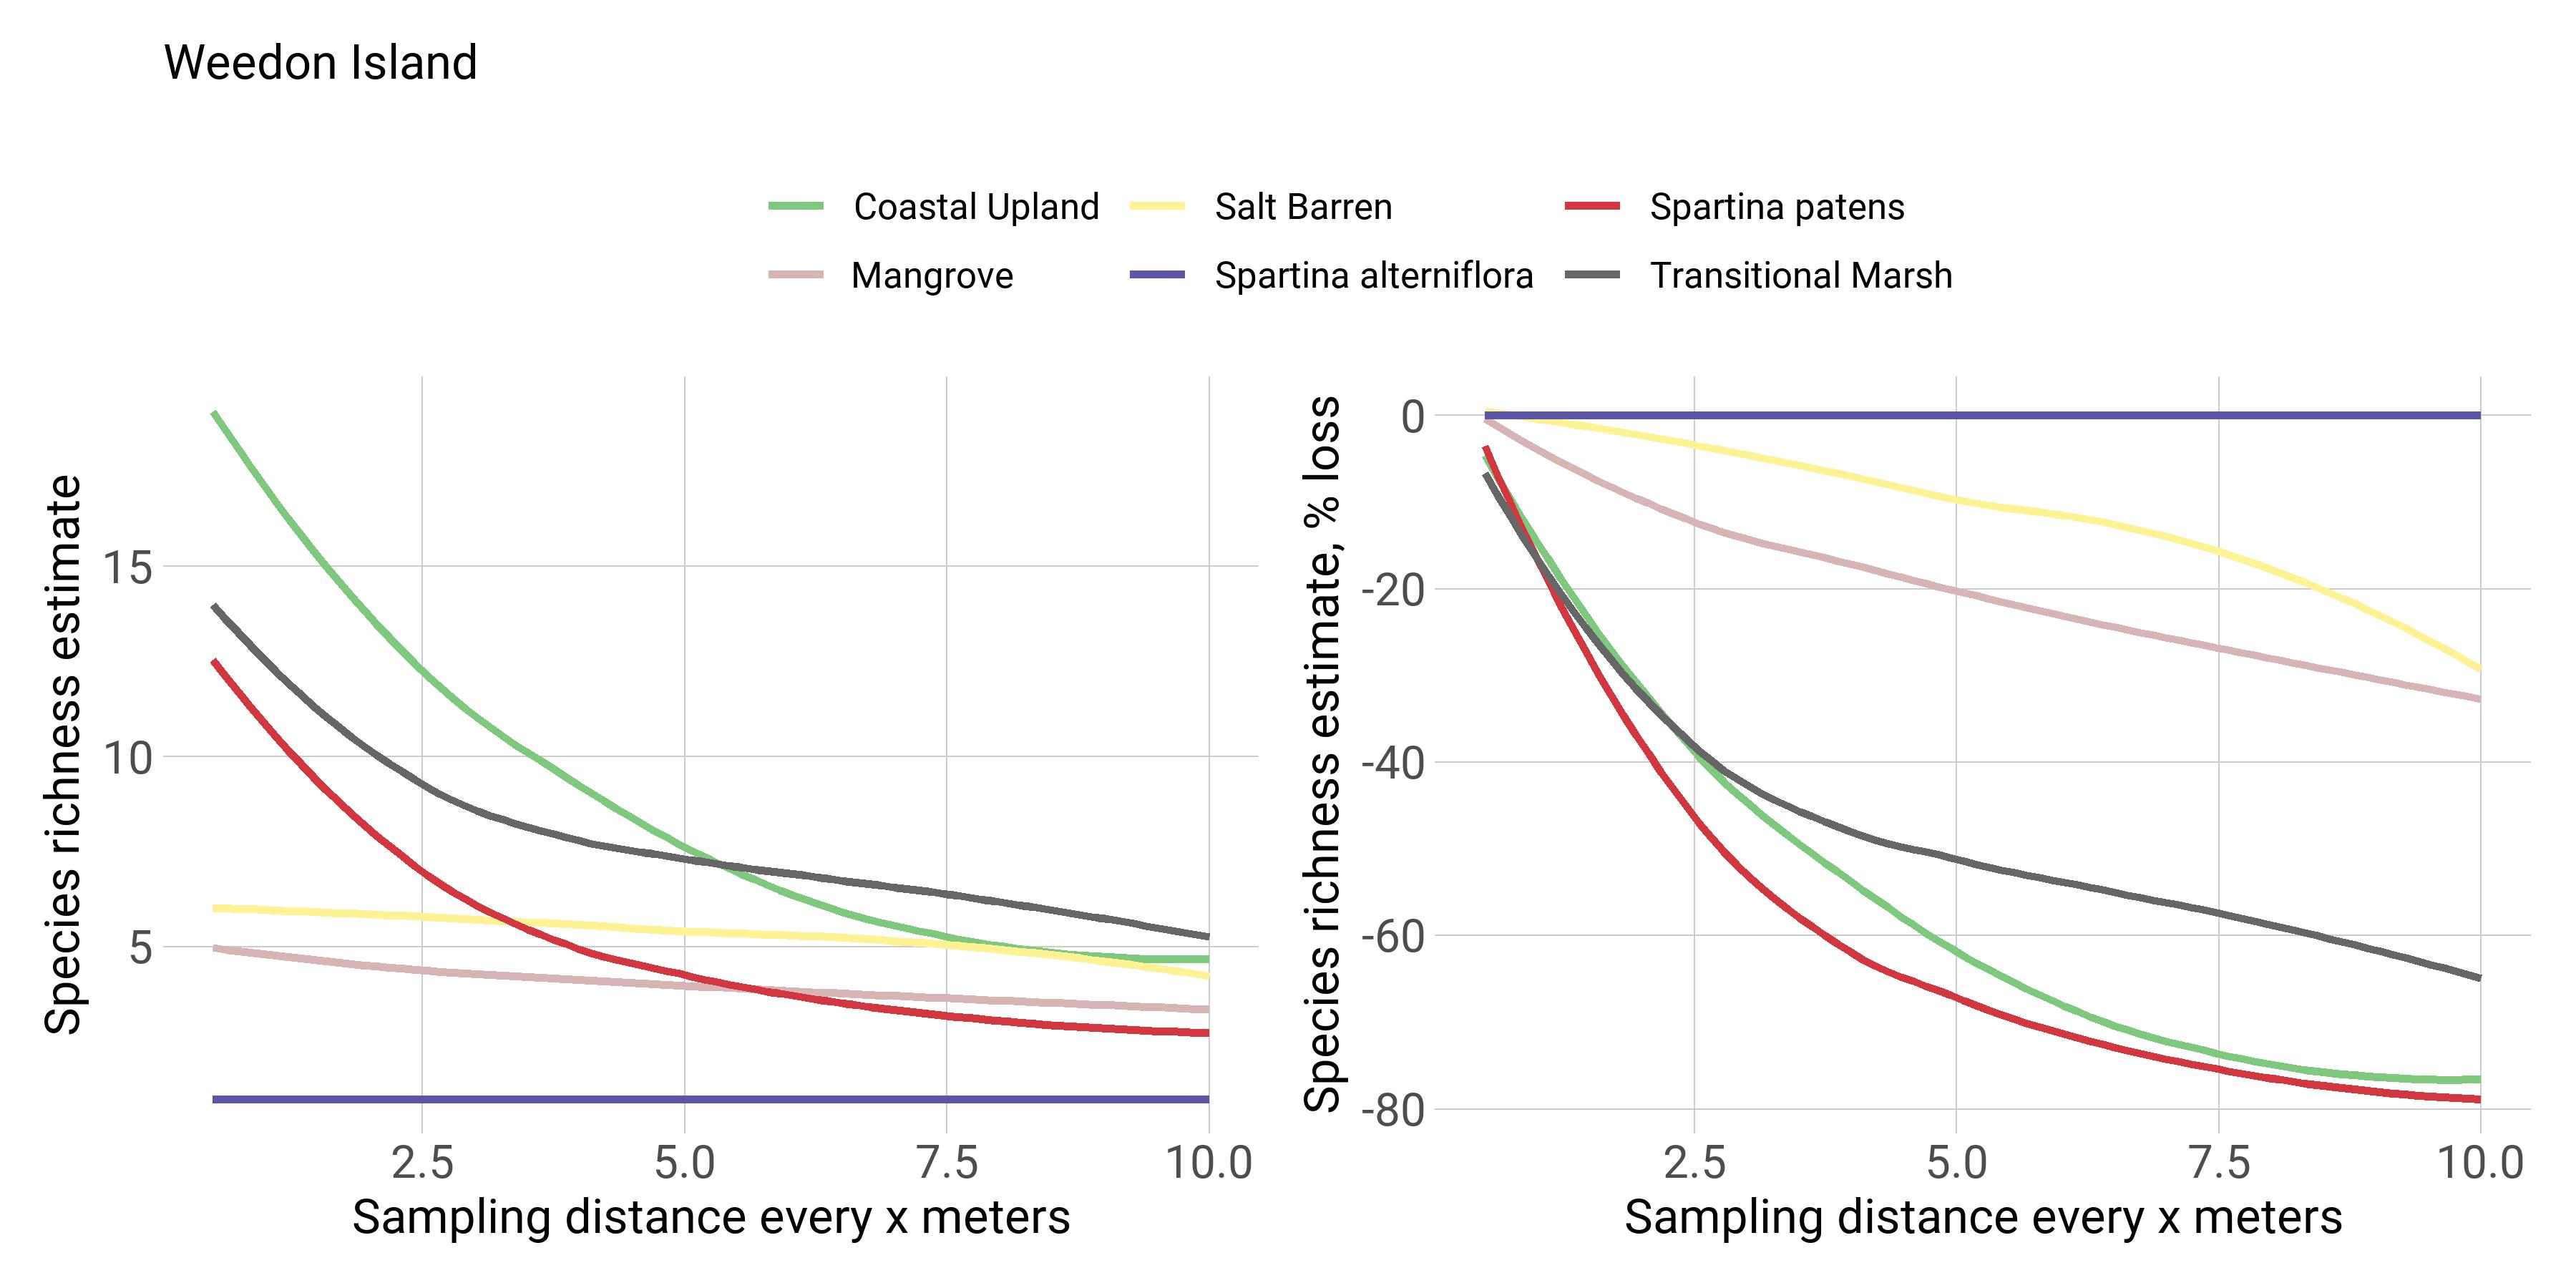
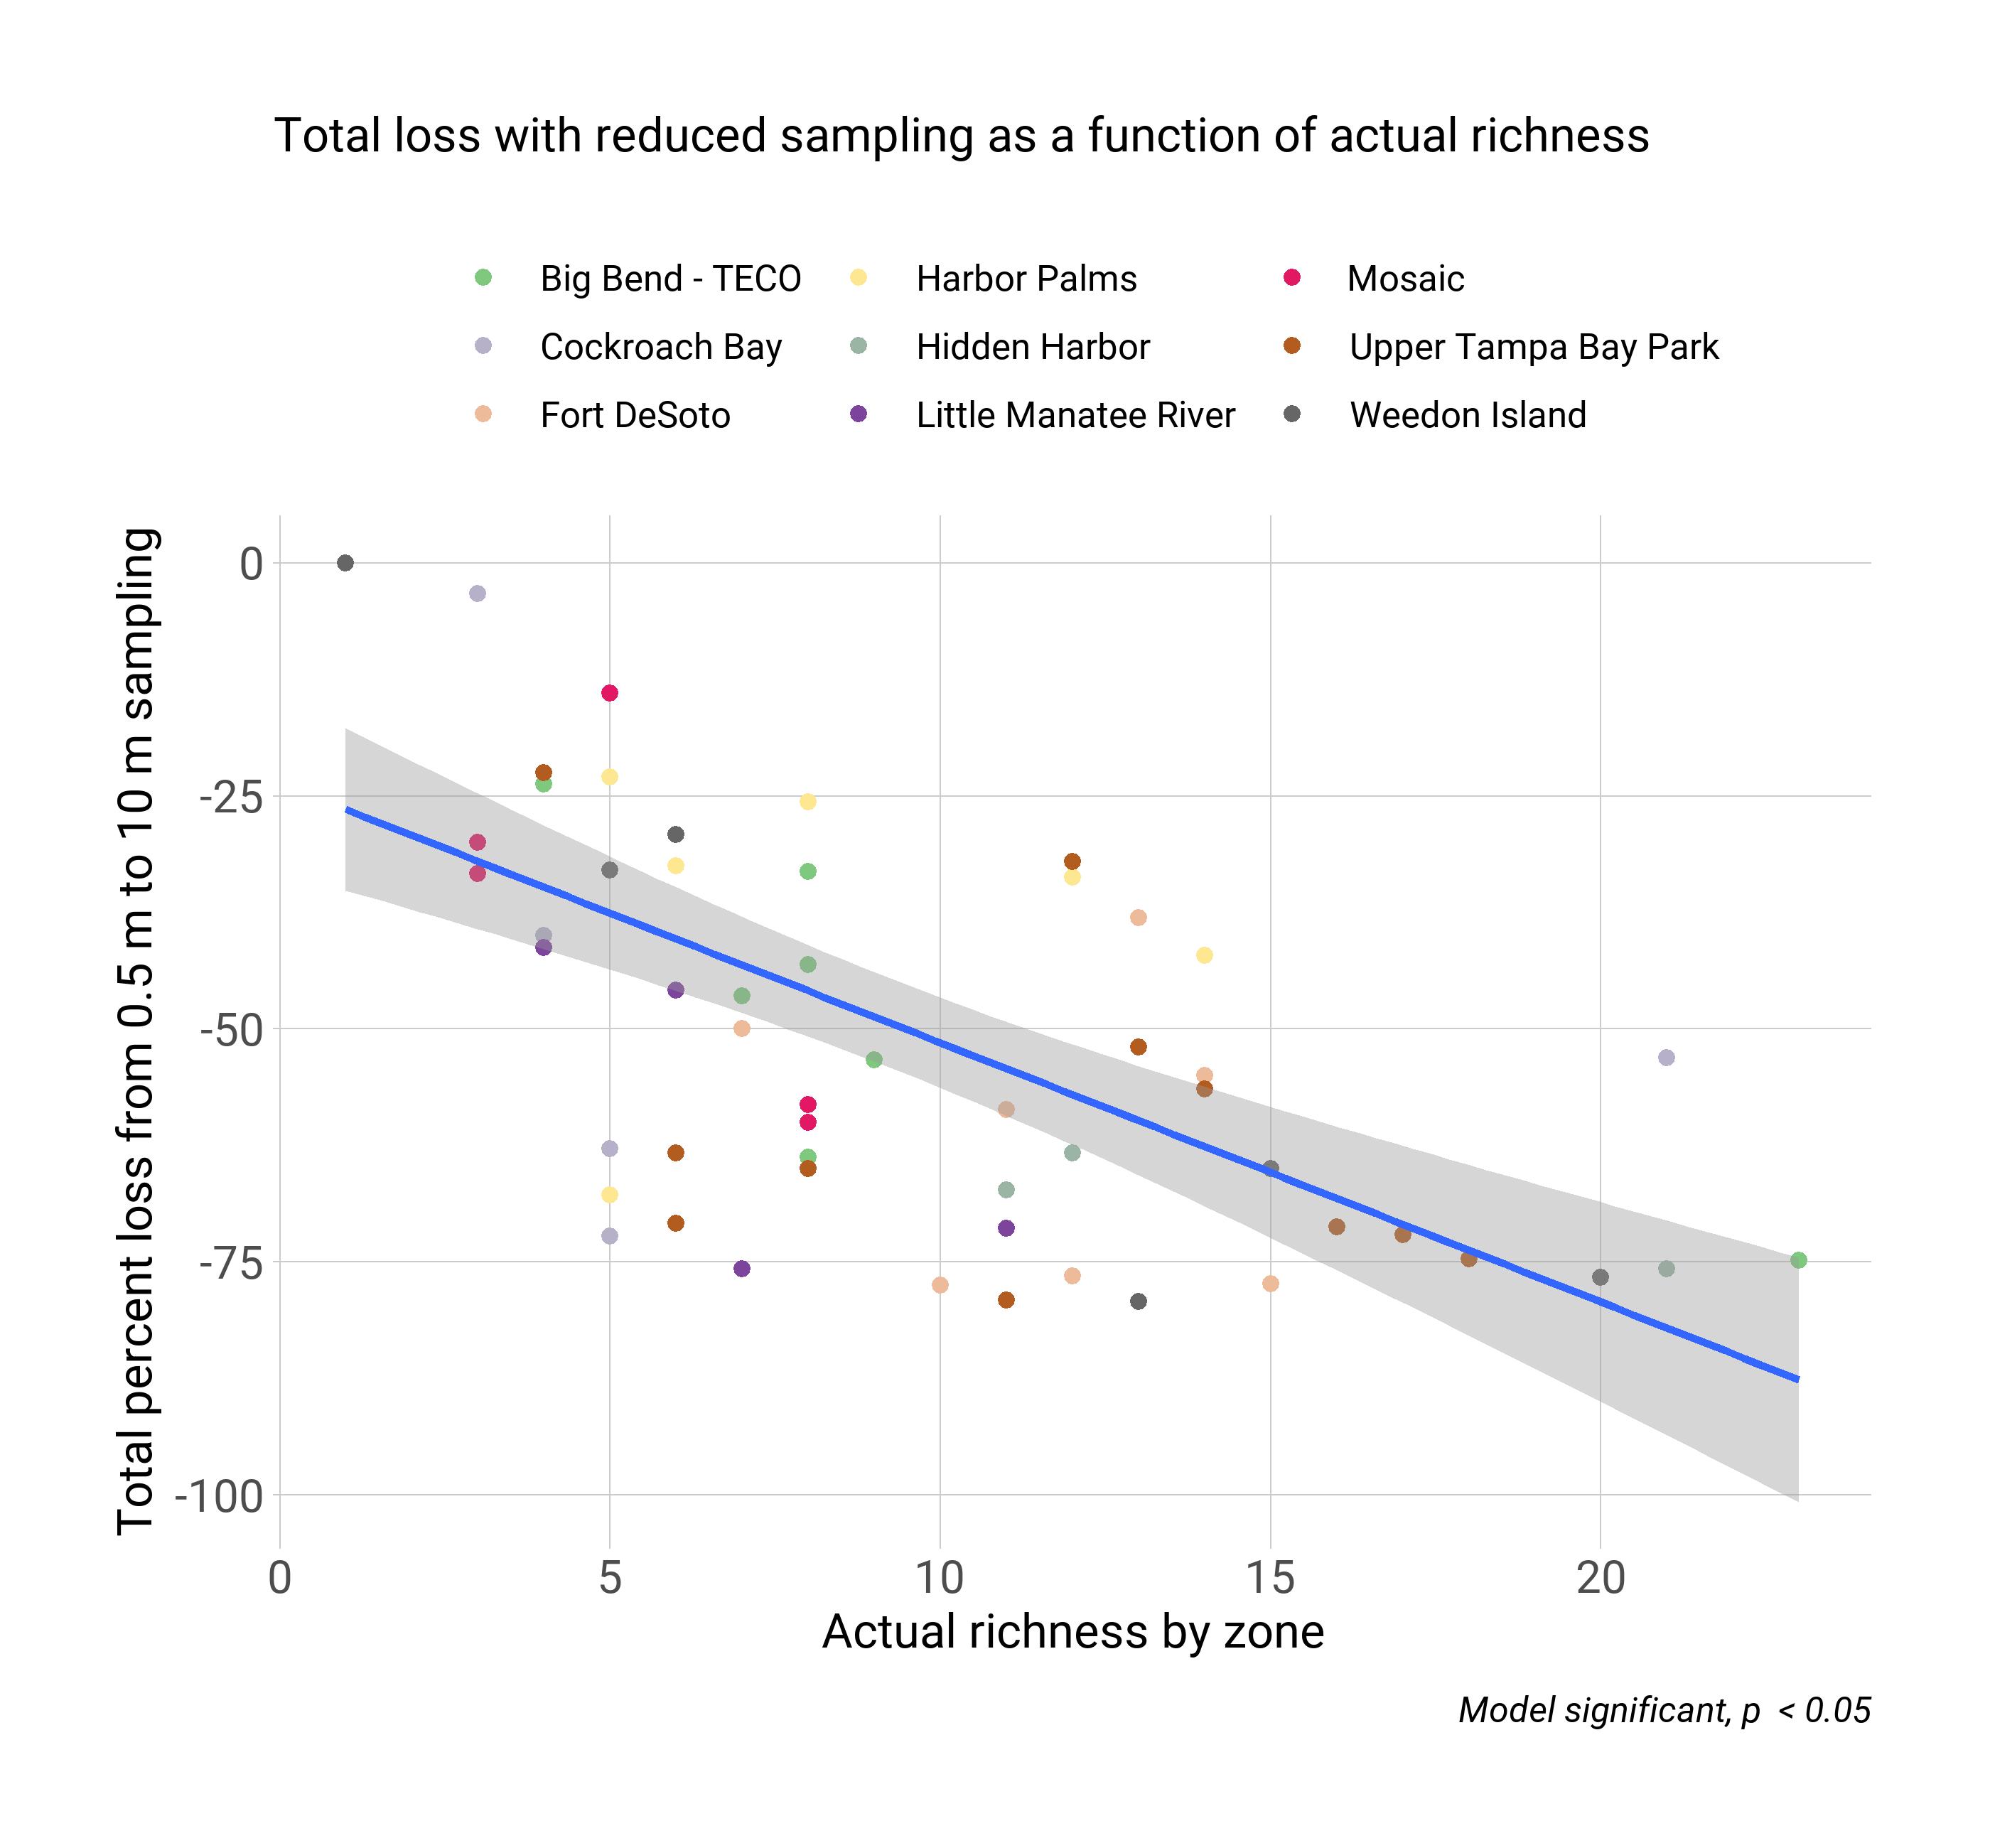
There is strong evidence that a greater reduction in species richness is expected at zones with higher richness.