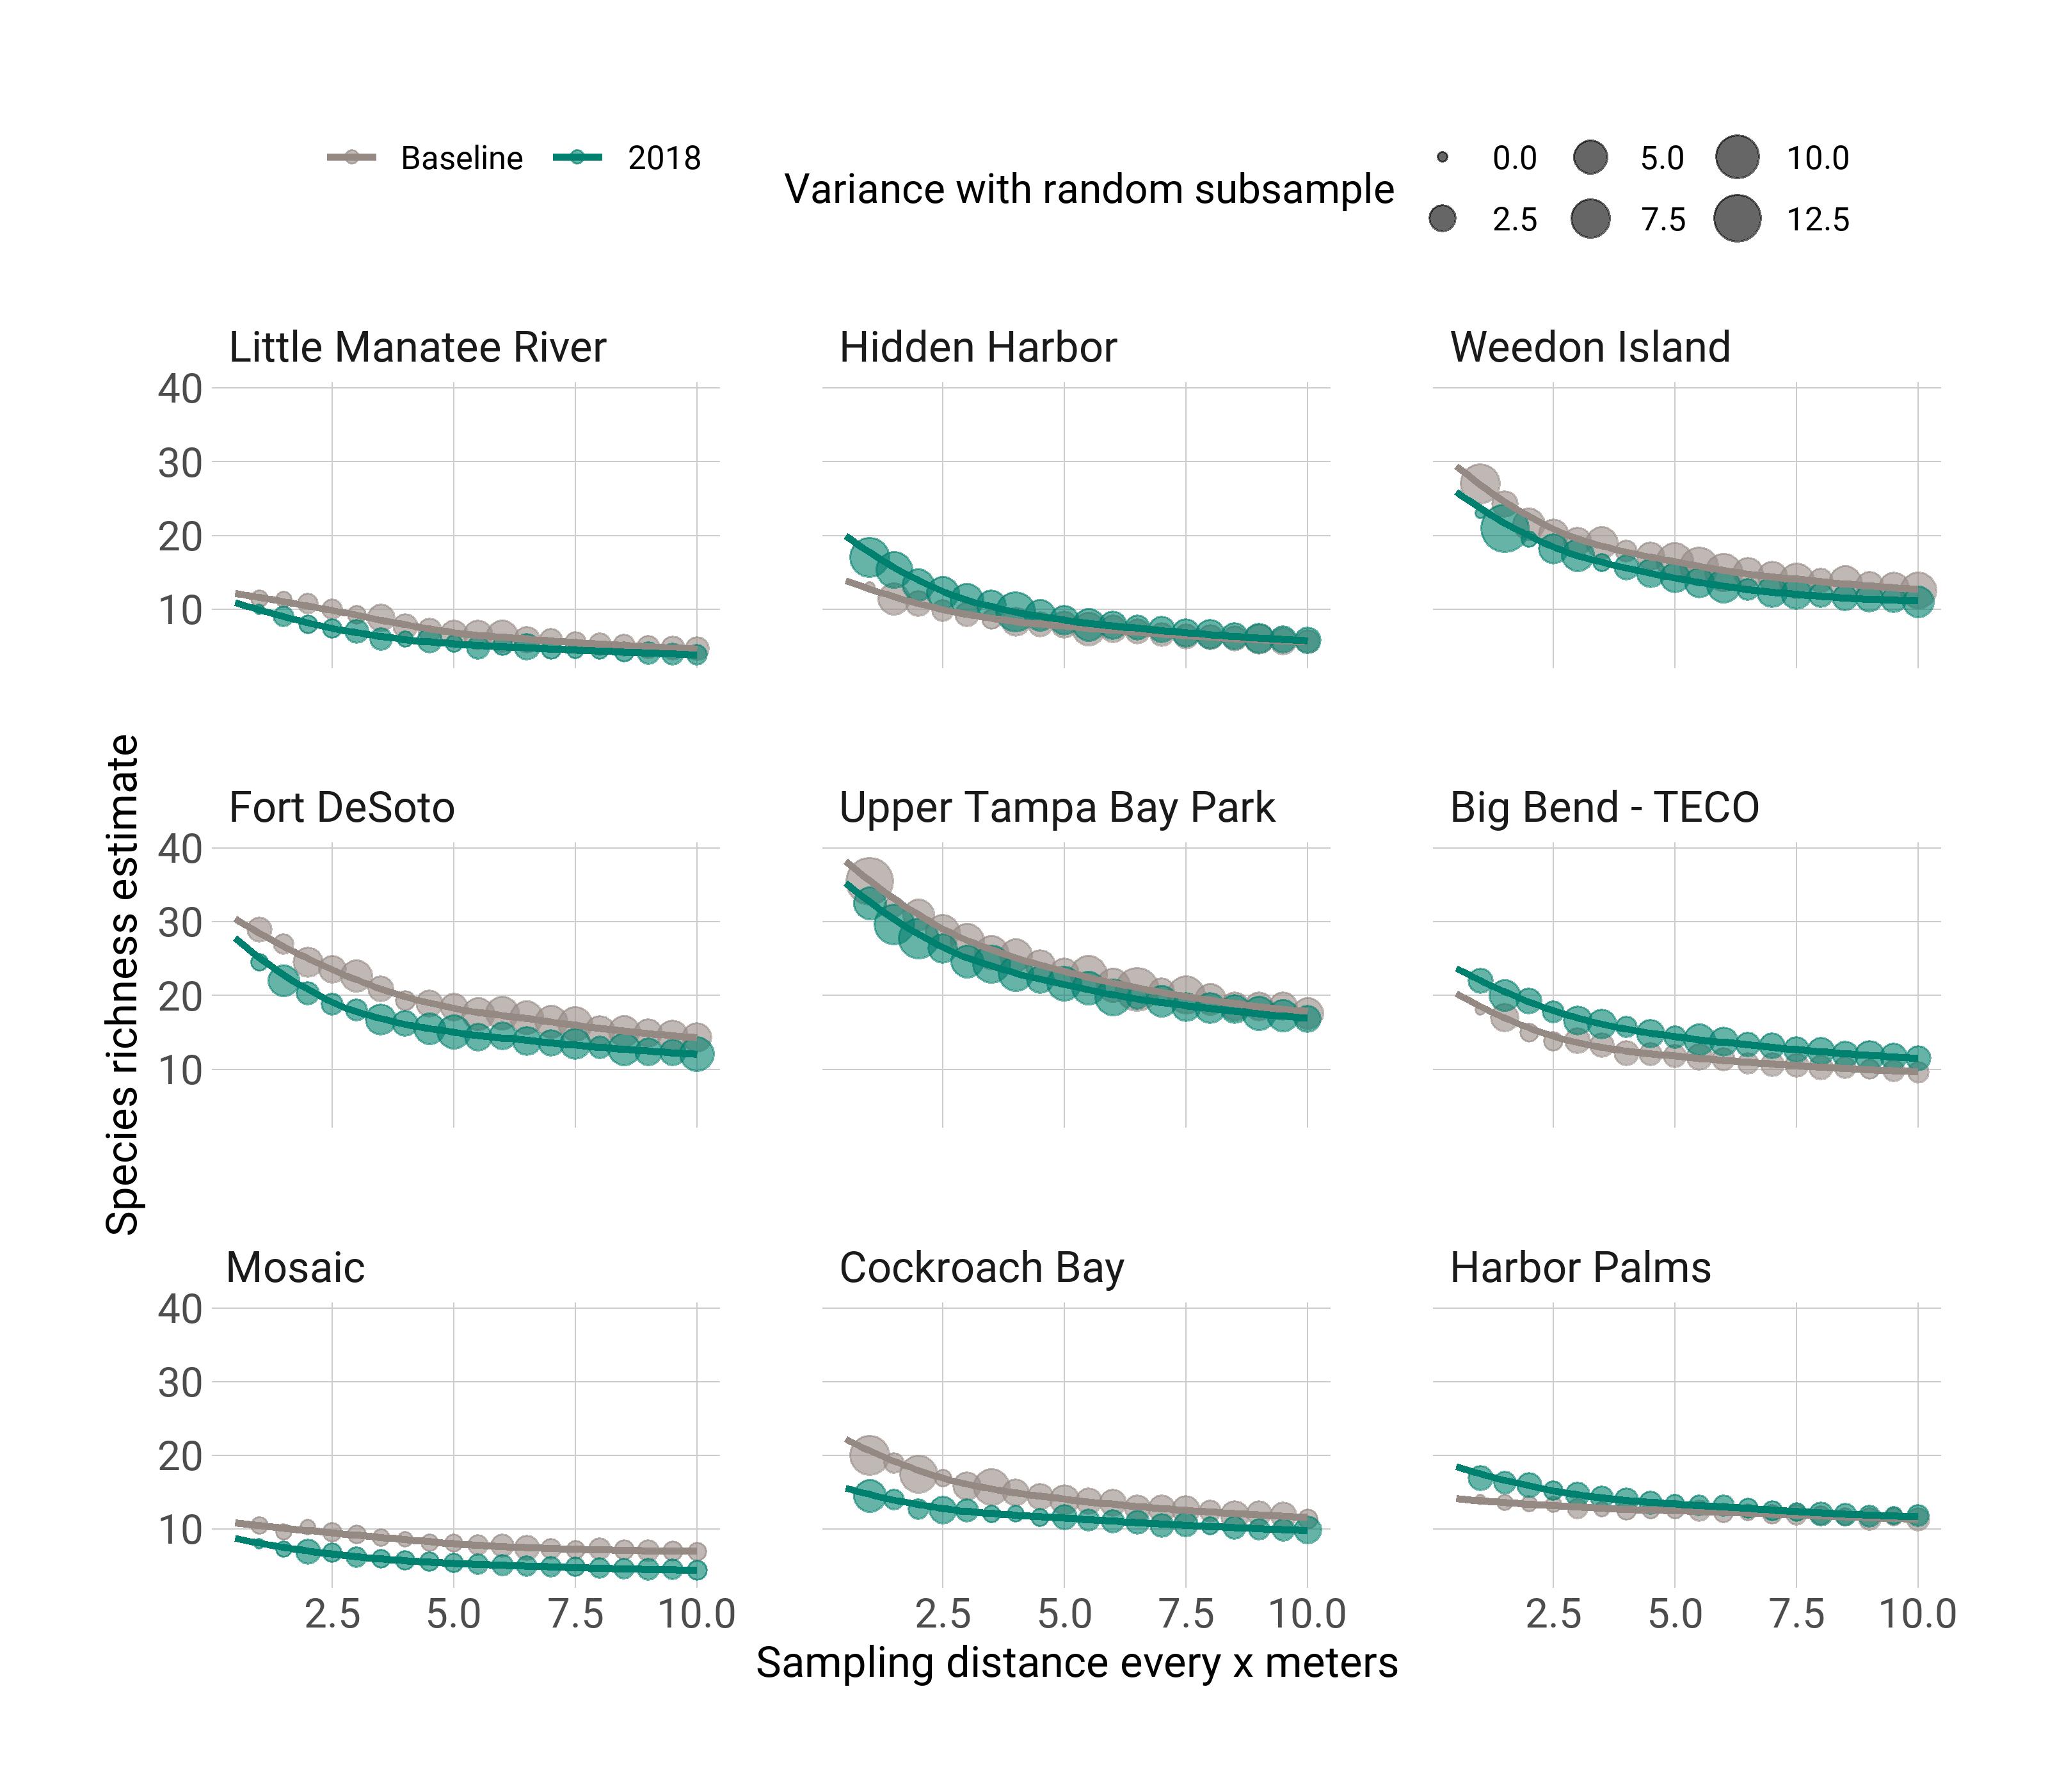
Richness
These plots show the effect of down-sampling on richness estimates at each site, grouped by year of sampling. The top plot shows points as the average estimate at each down-sampled survey for the sampling distance shown on the x-axis. The lines are polynomial smooths to show the trend. The size of each point is in proportion to the variance of the species richness estimate for each random sub-sample at the specified level of sampling. Facets are arranged based on the greatest reduction in species richness as a percentage of the total.
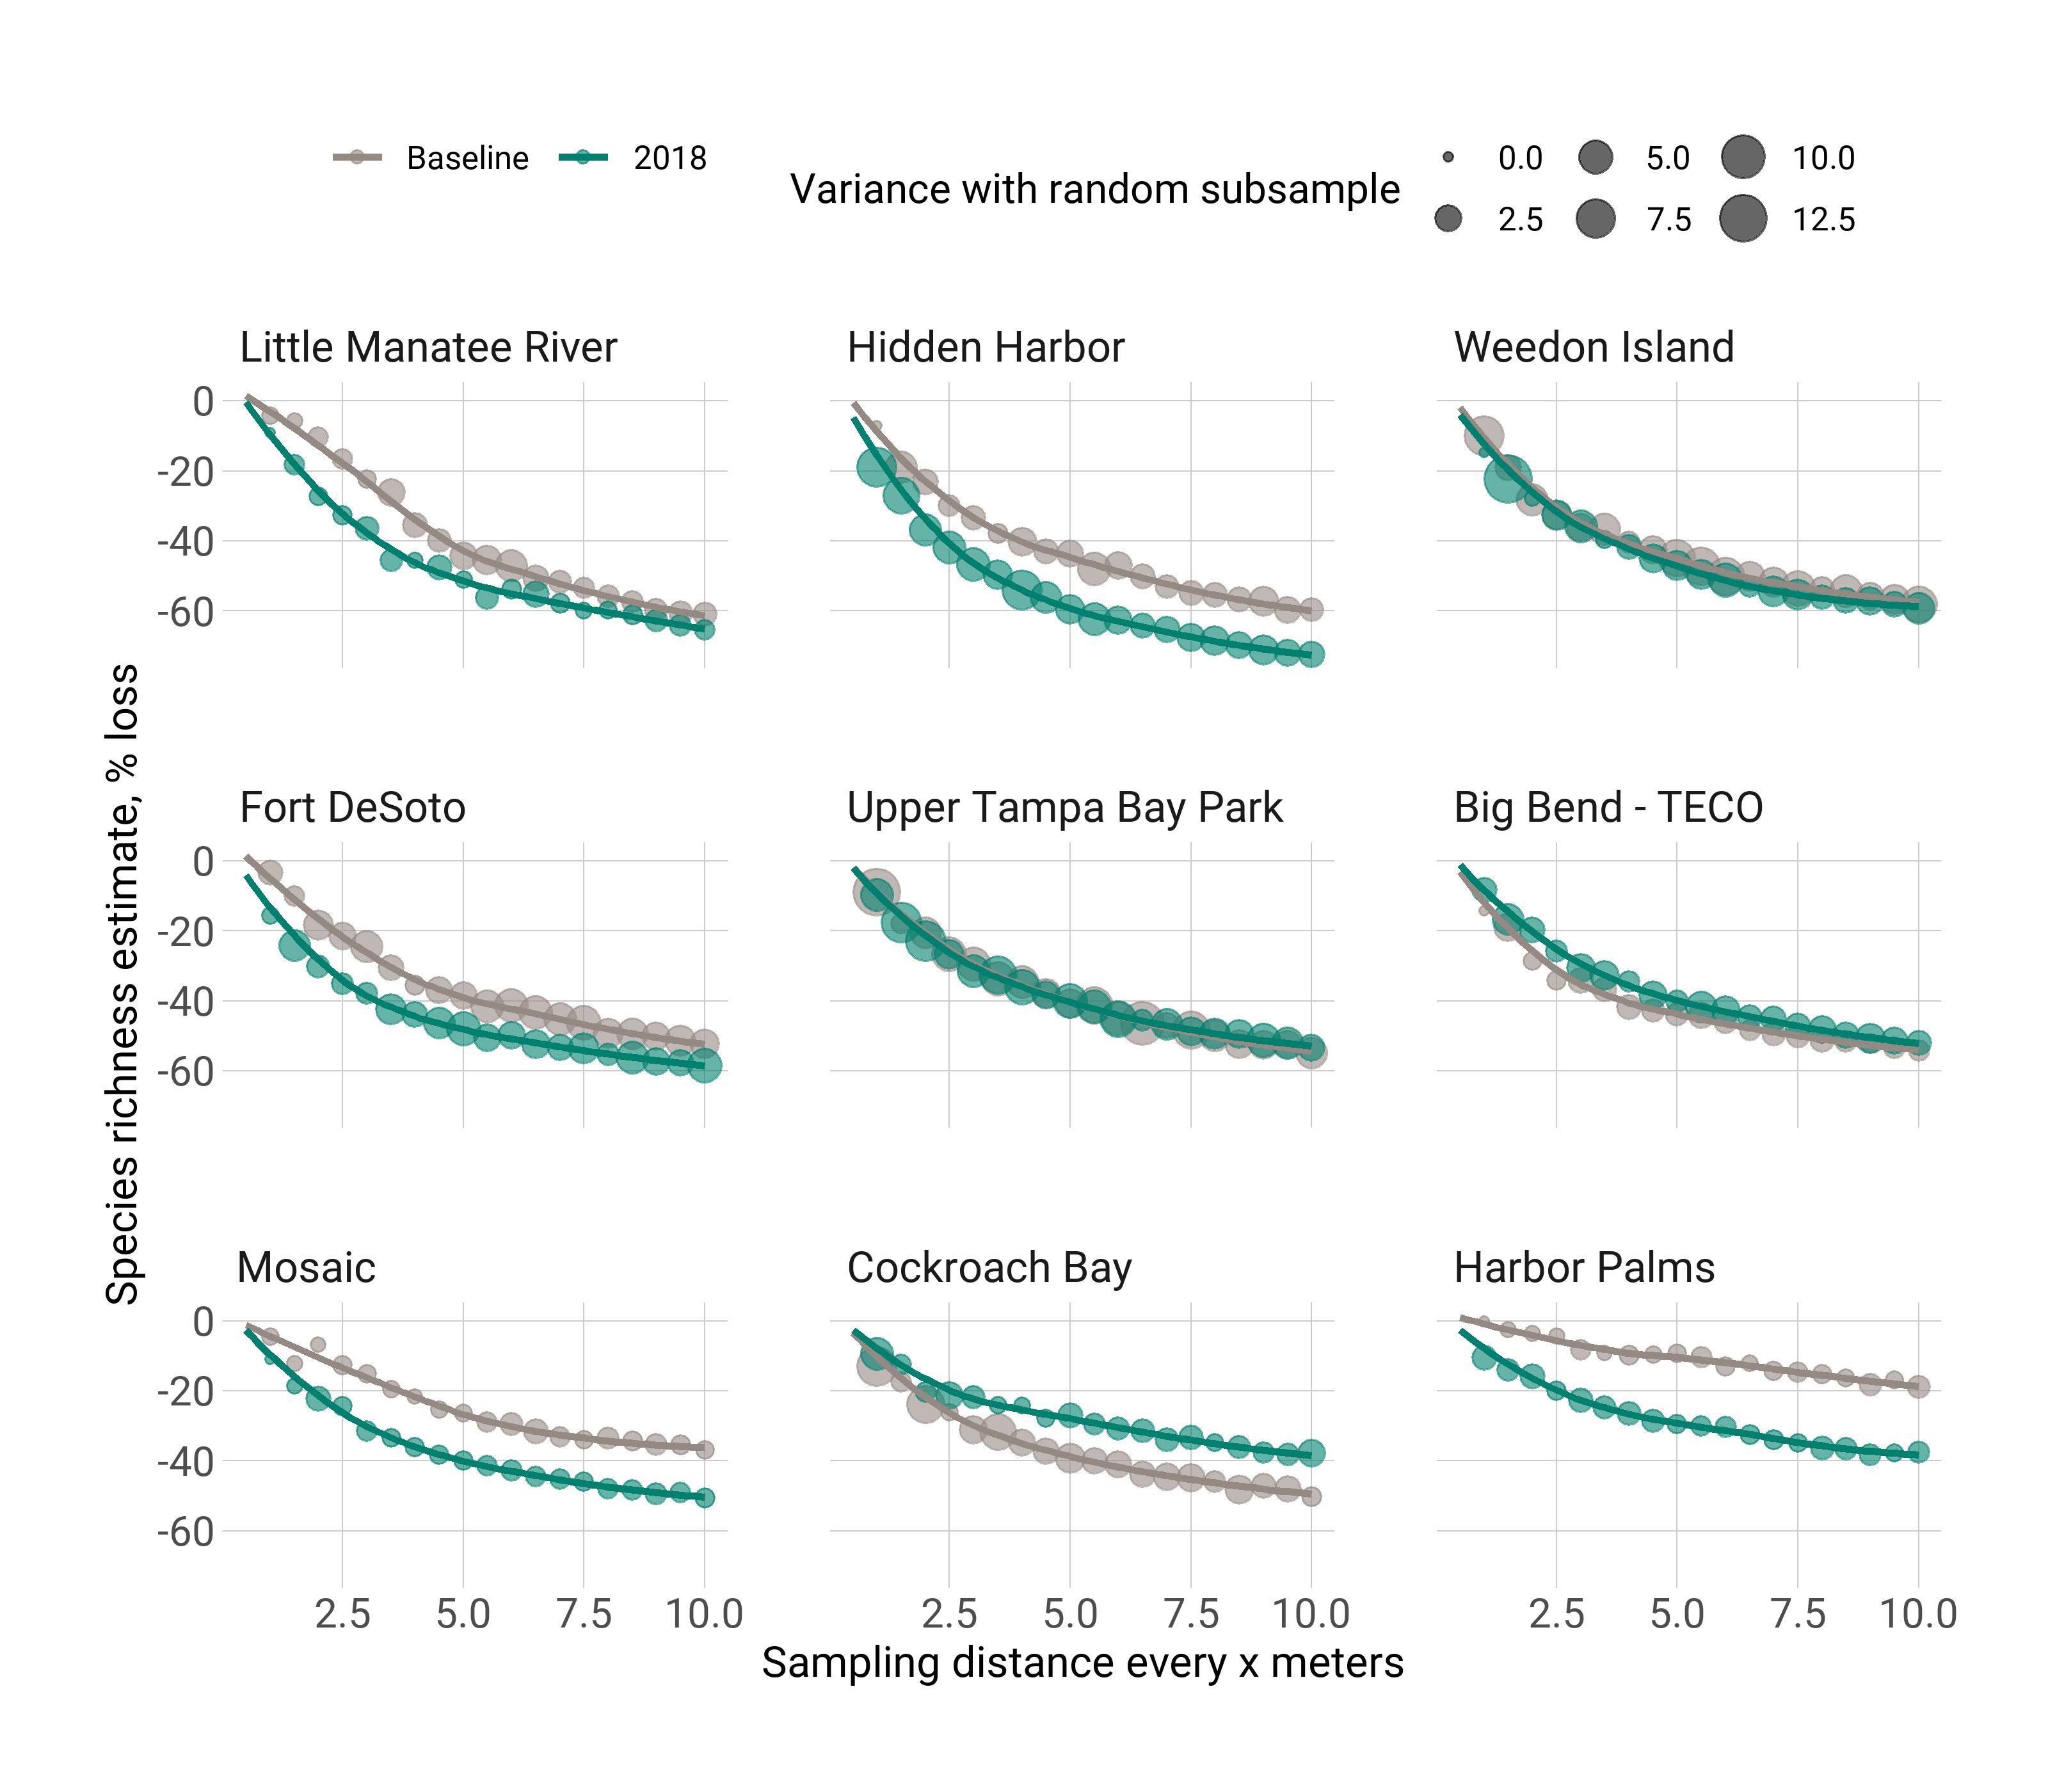
These plots are similar to the above, but richness is scaled as a percentage of the total at full sample effort. This allows for a comparison of a reduction in the estimate independent of the overall species richness. That is, the sensitivity of the richness estimate at a site may vary depending on overall species richness.
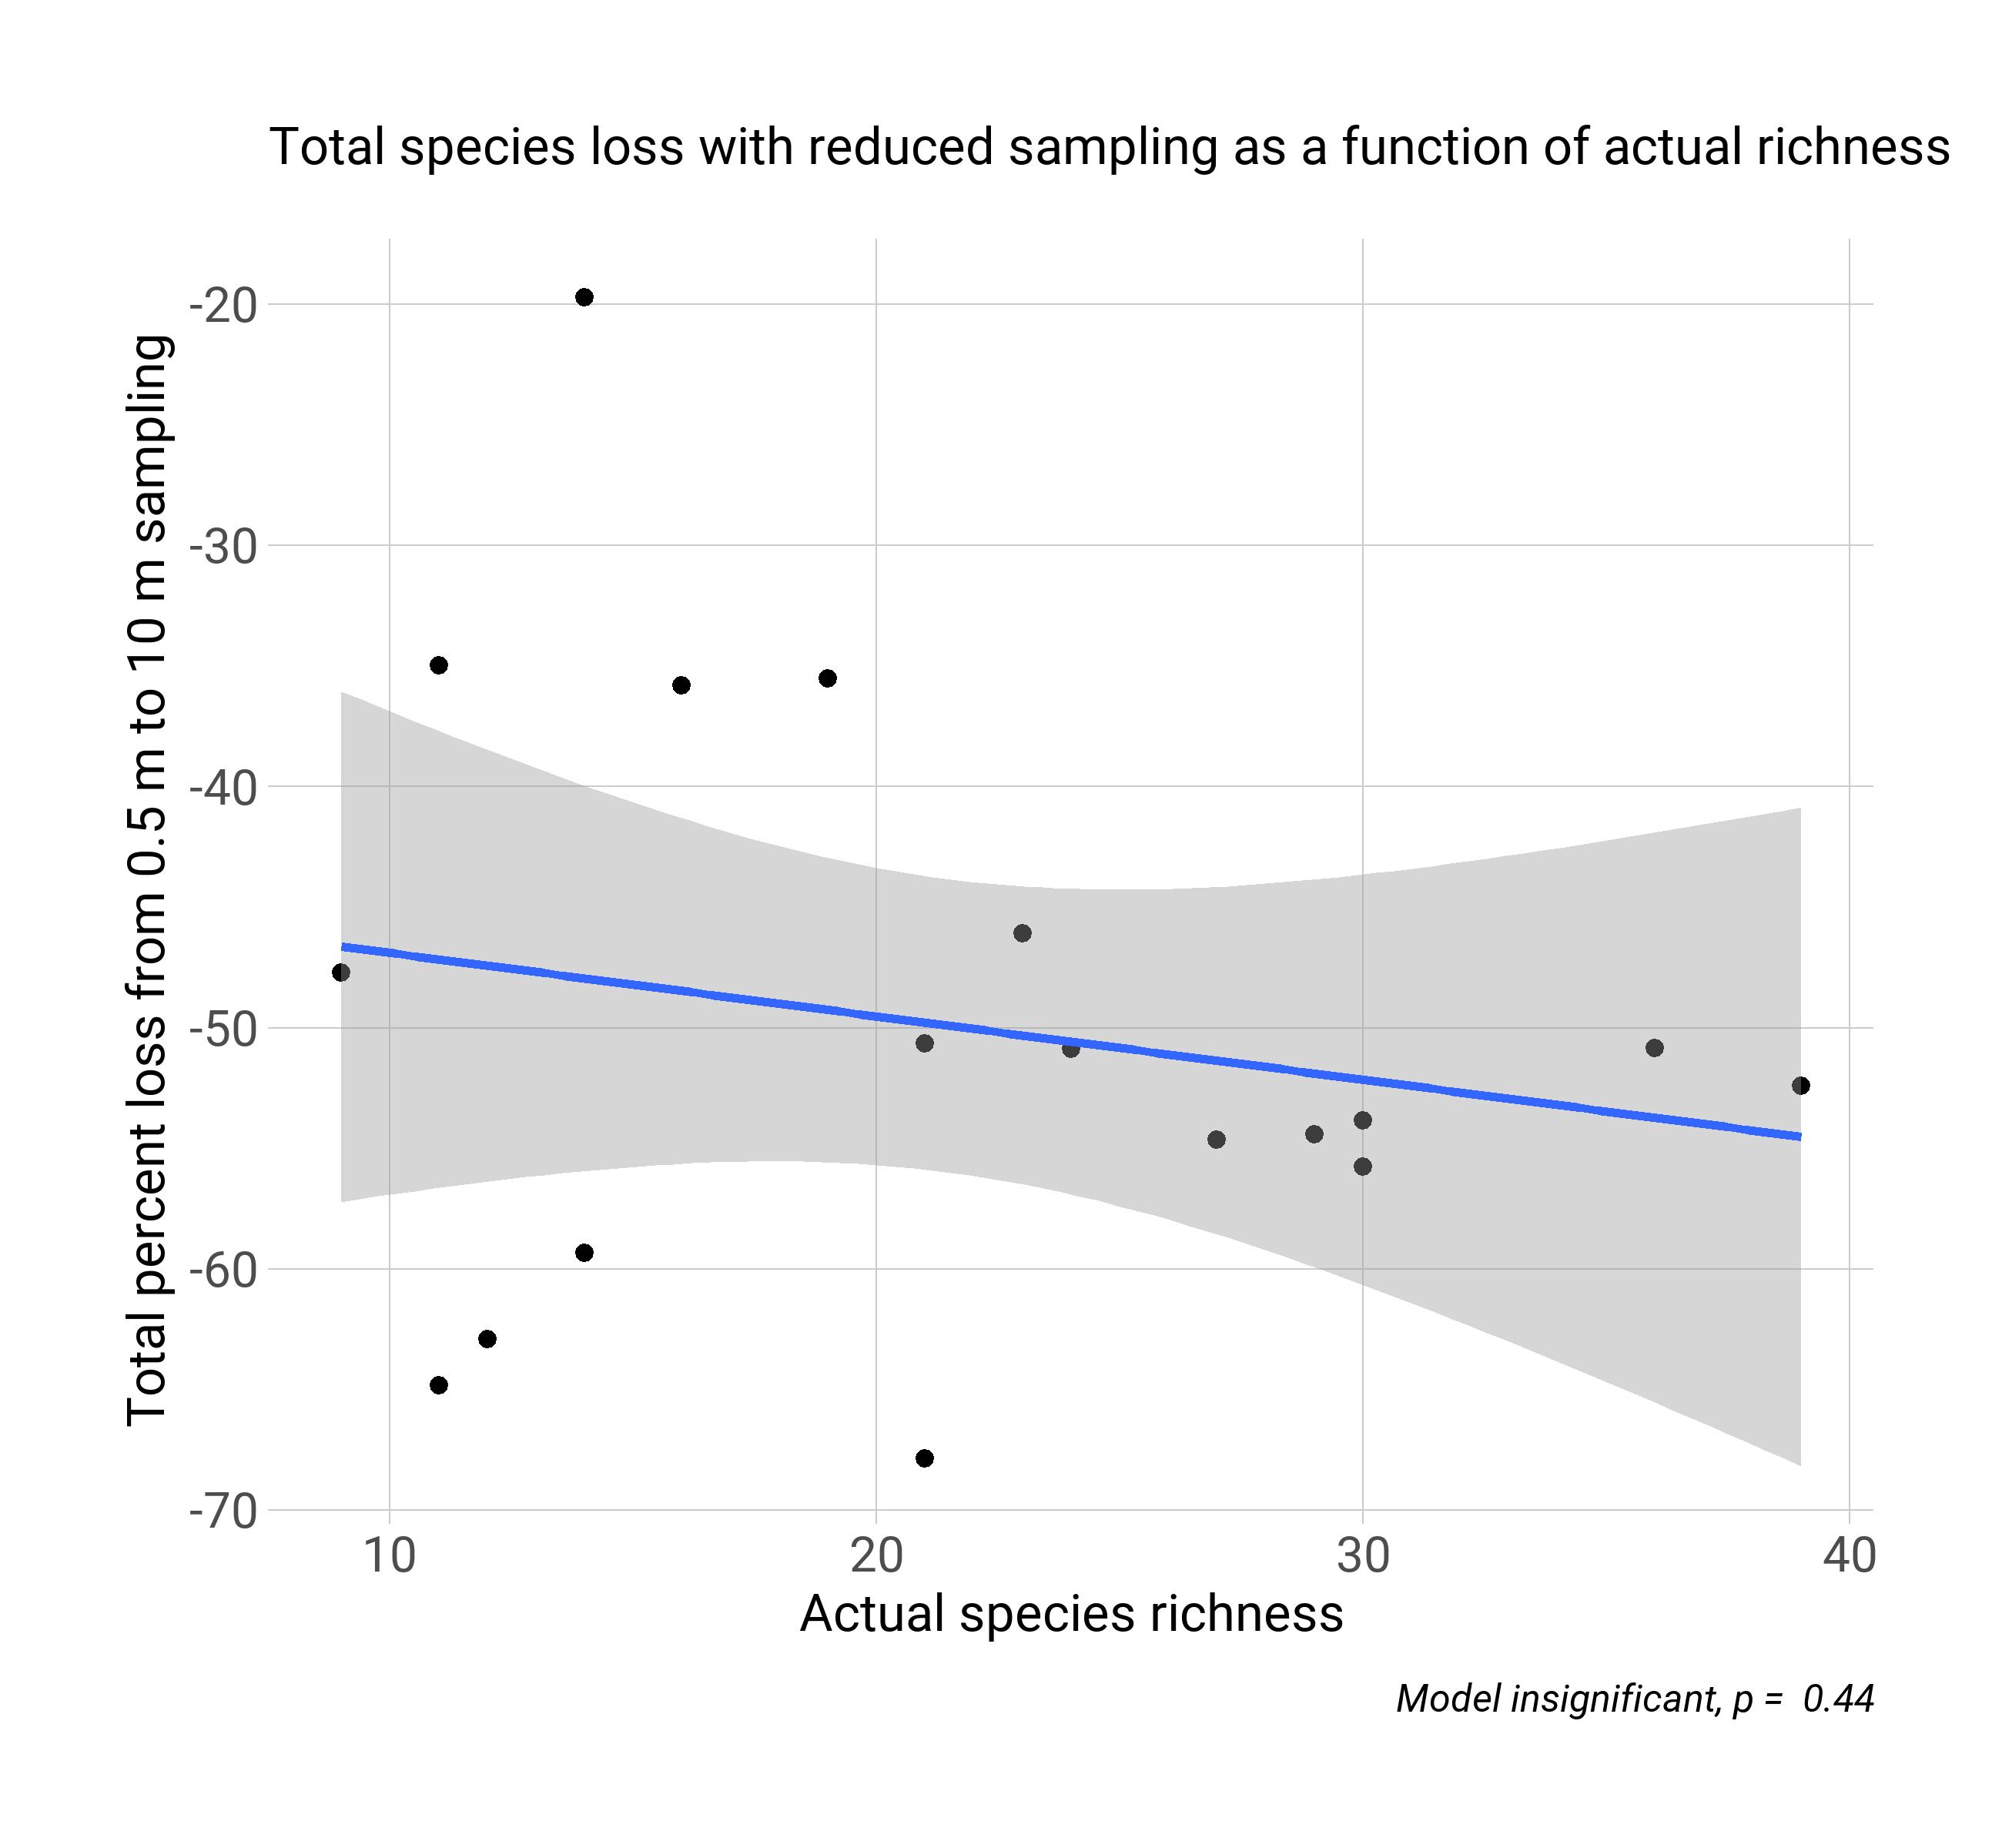
There is some evidence that a greater reduction in species richness is expected at sites with higher richness, although the model is insignificant.