Zone distances
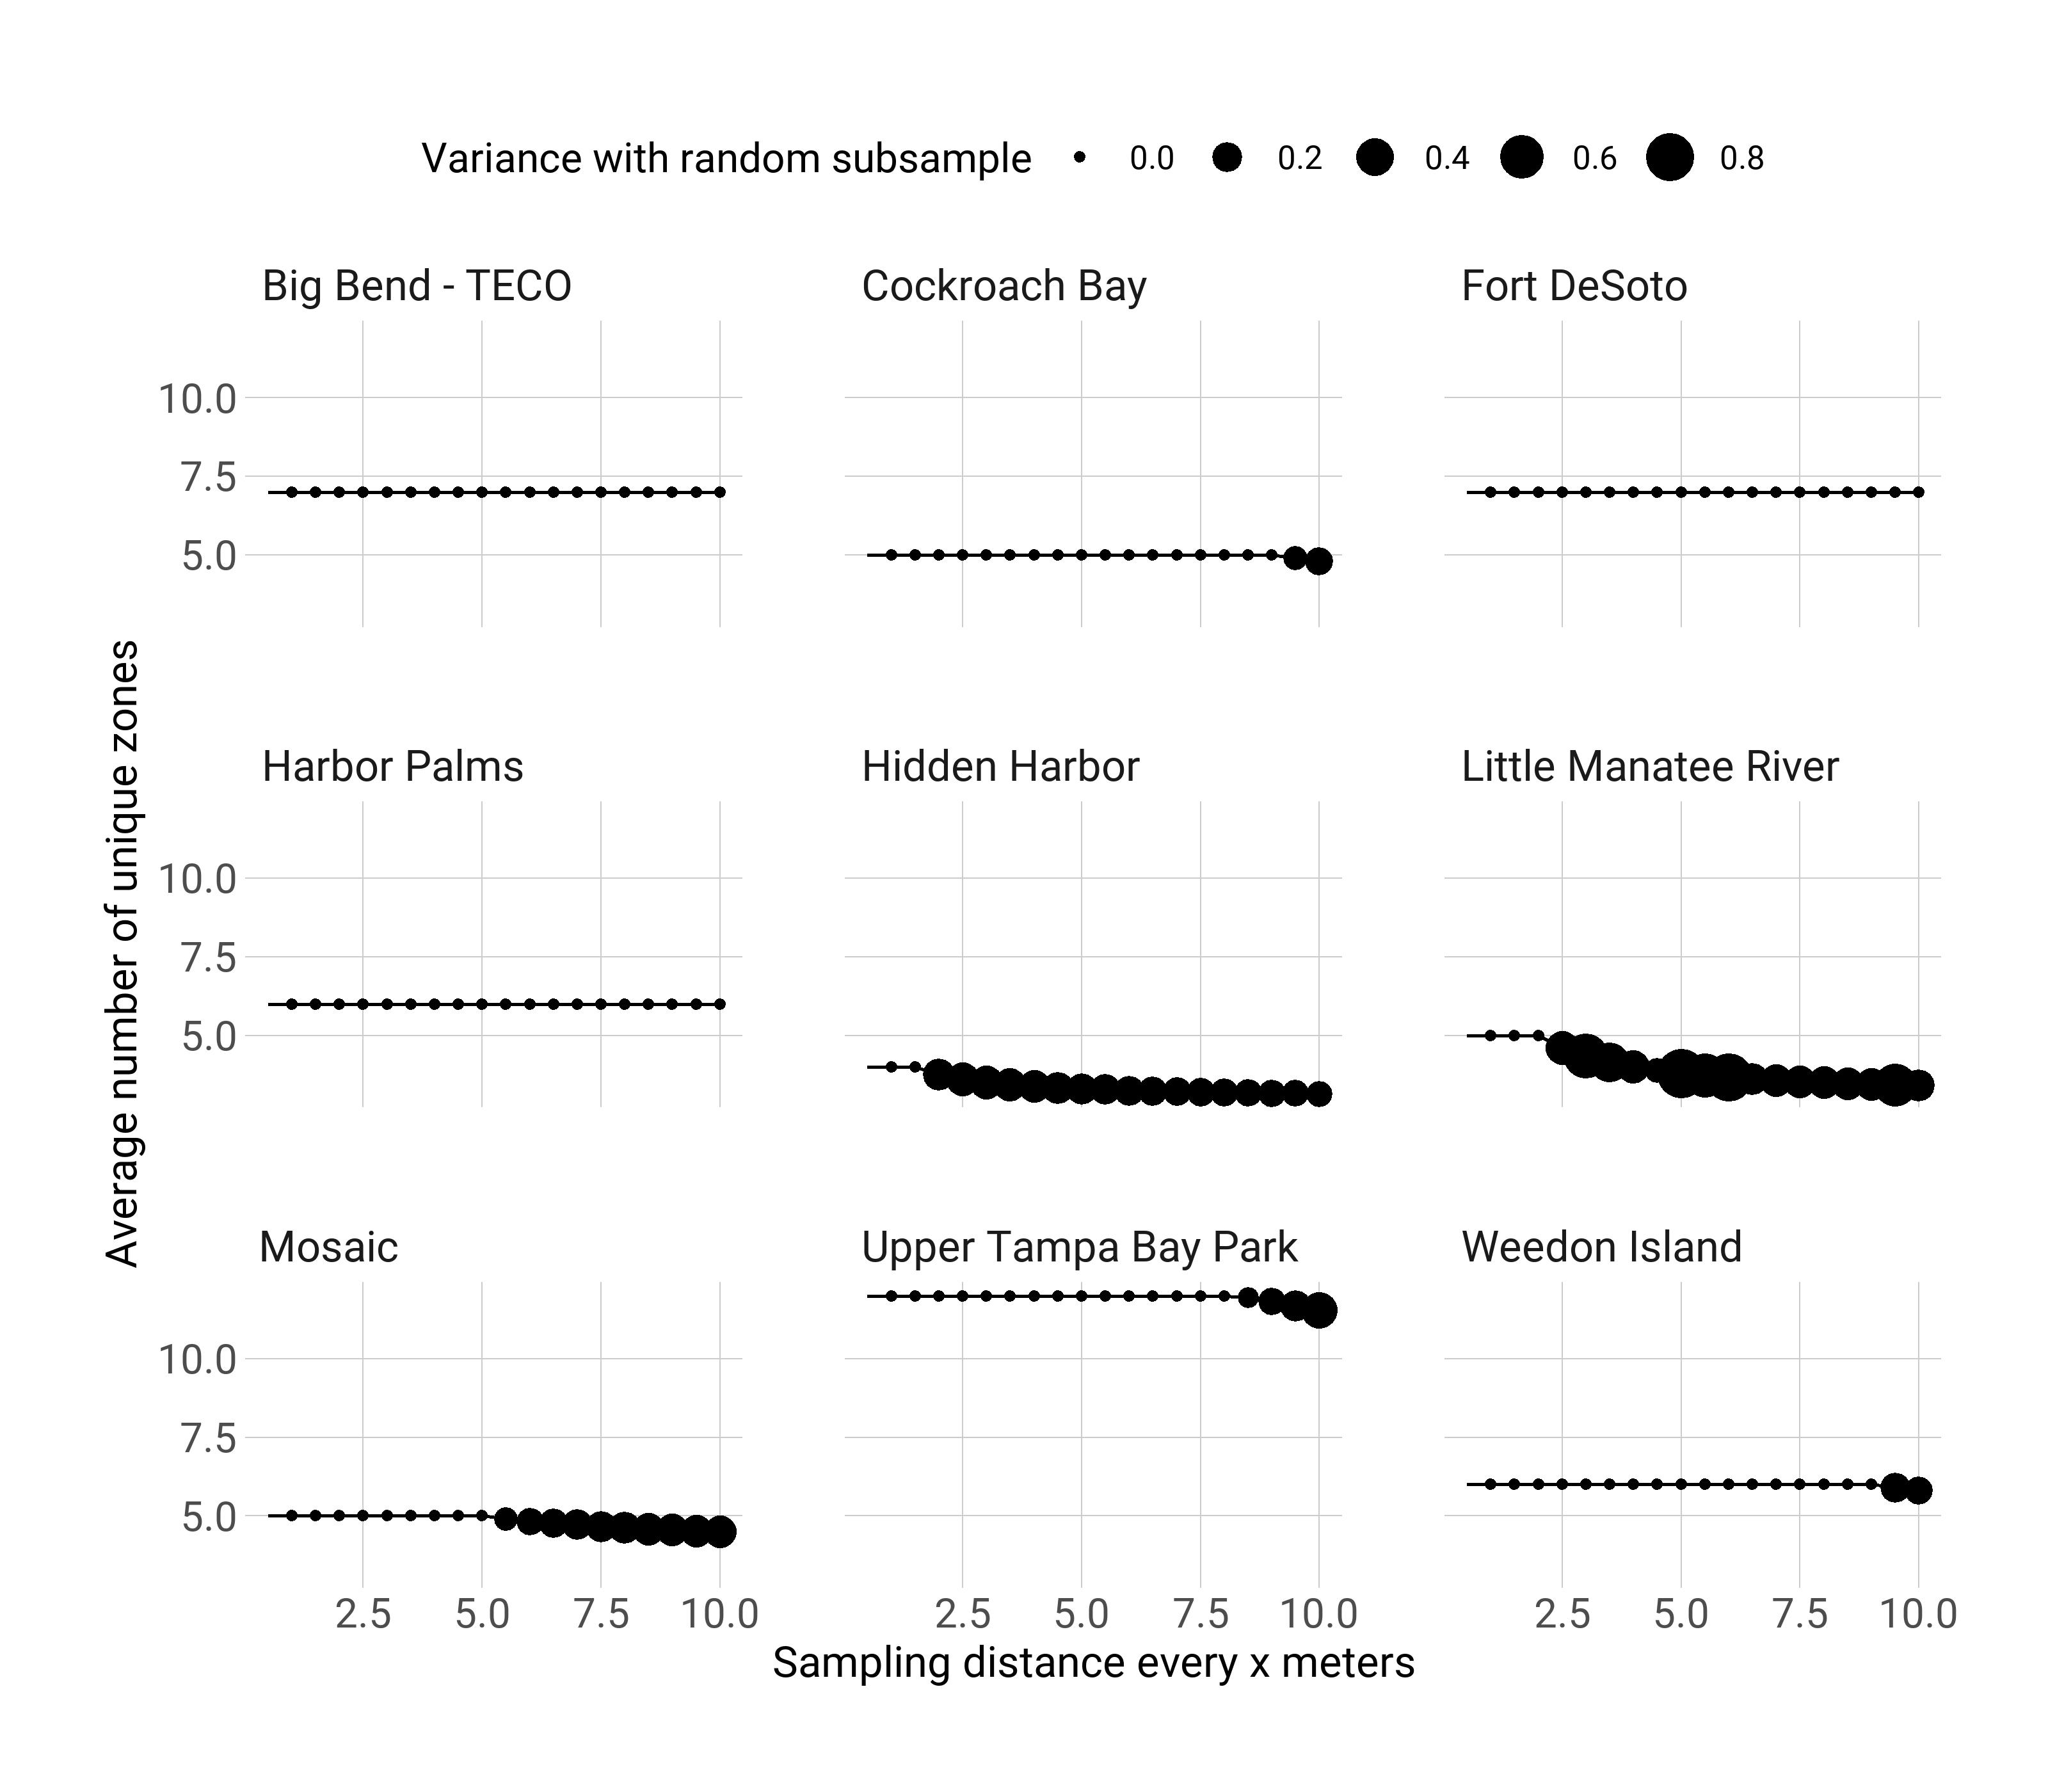
Estimates of the counts and distances for each zone along the transects are shown below for reductions in sample effort. The first plot shows the number of unique zones identified with down-sampling. Points are sized by the variance of the estimates across the random subsamples at level of sample effort. All zones are identified at each site until the length of the shortest zone is less than the sampling interval.
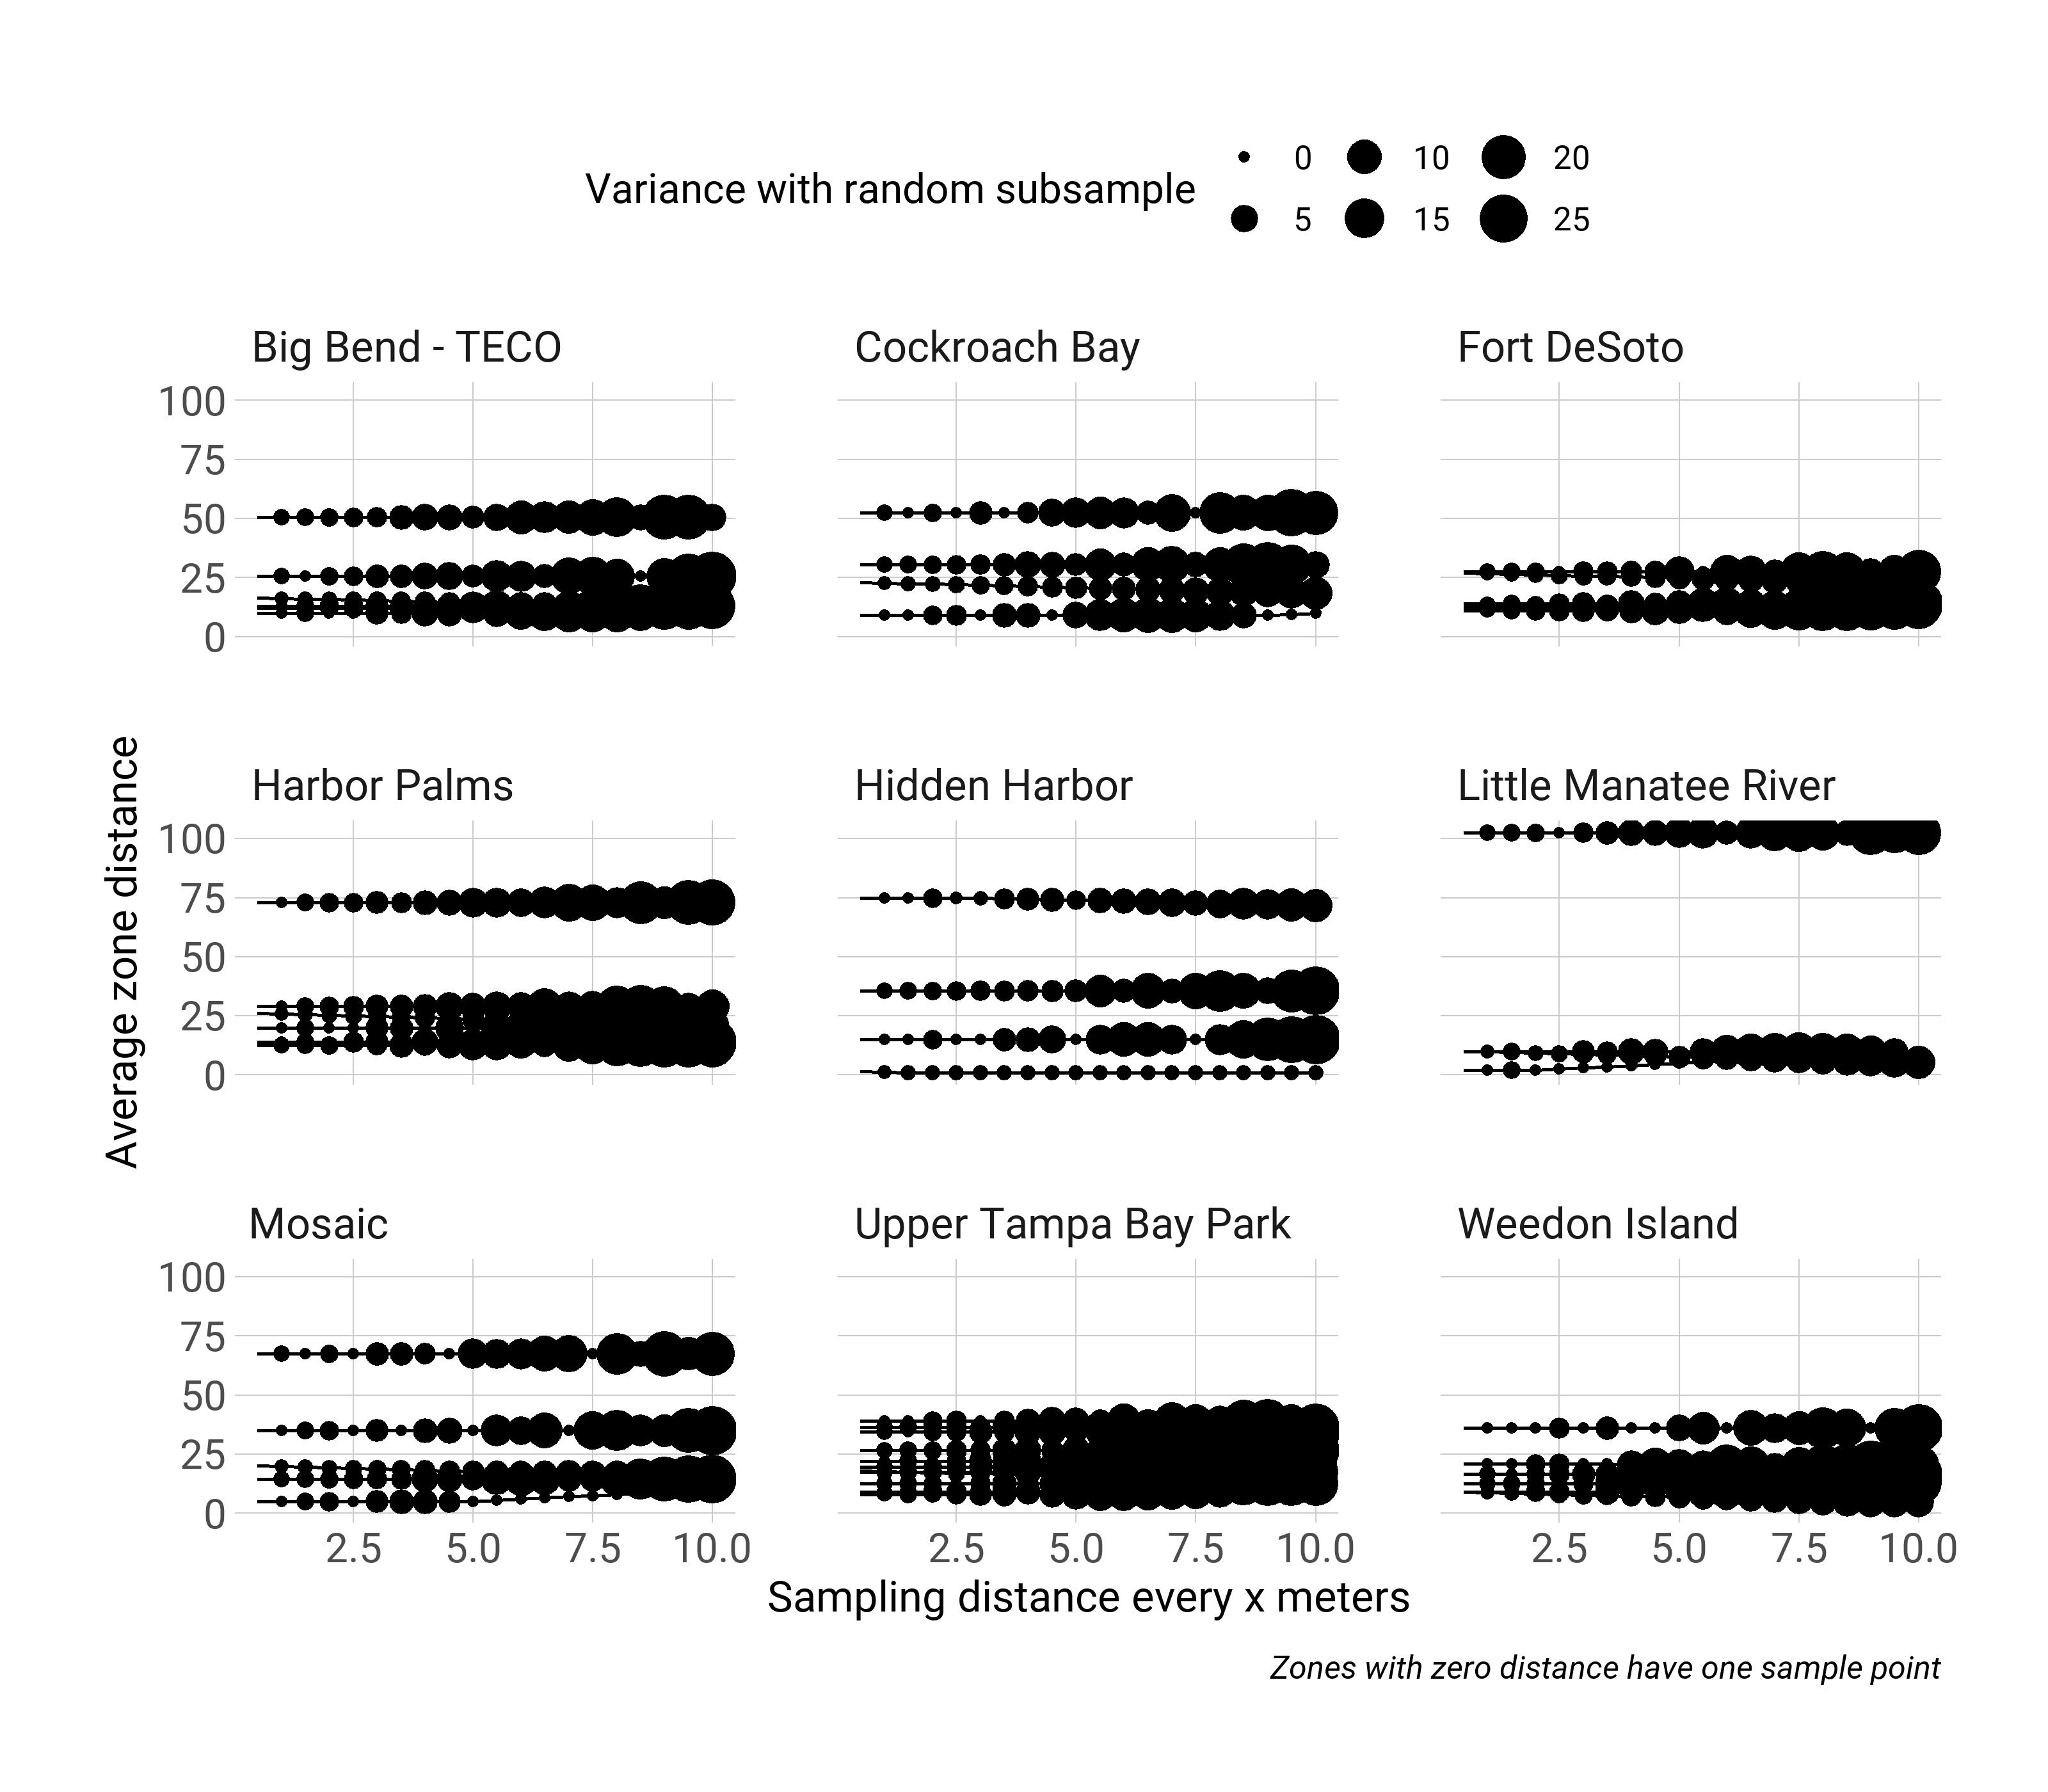
The estimated length of each zone at each site is shown below with reductions in sample effort. Each line represents a unique zone. Estimated zone lengths do not change with reduced effort. Points are sized by the variance of the estimates across the random subsamples at level of sample effort. Variance (or uncertainty) in the zone distances increases with reduced effort.
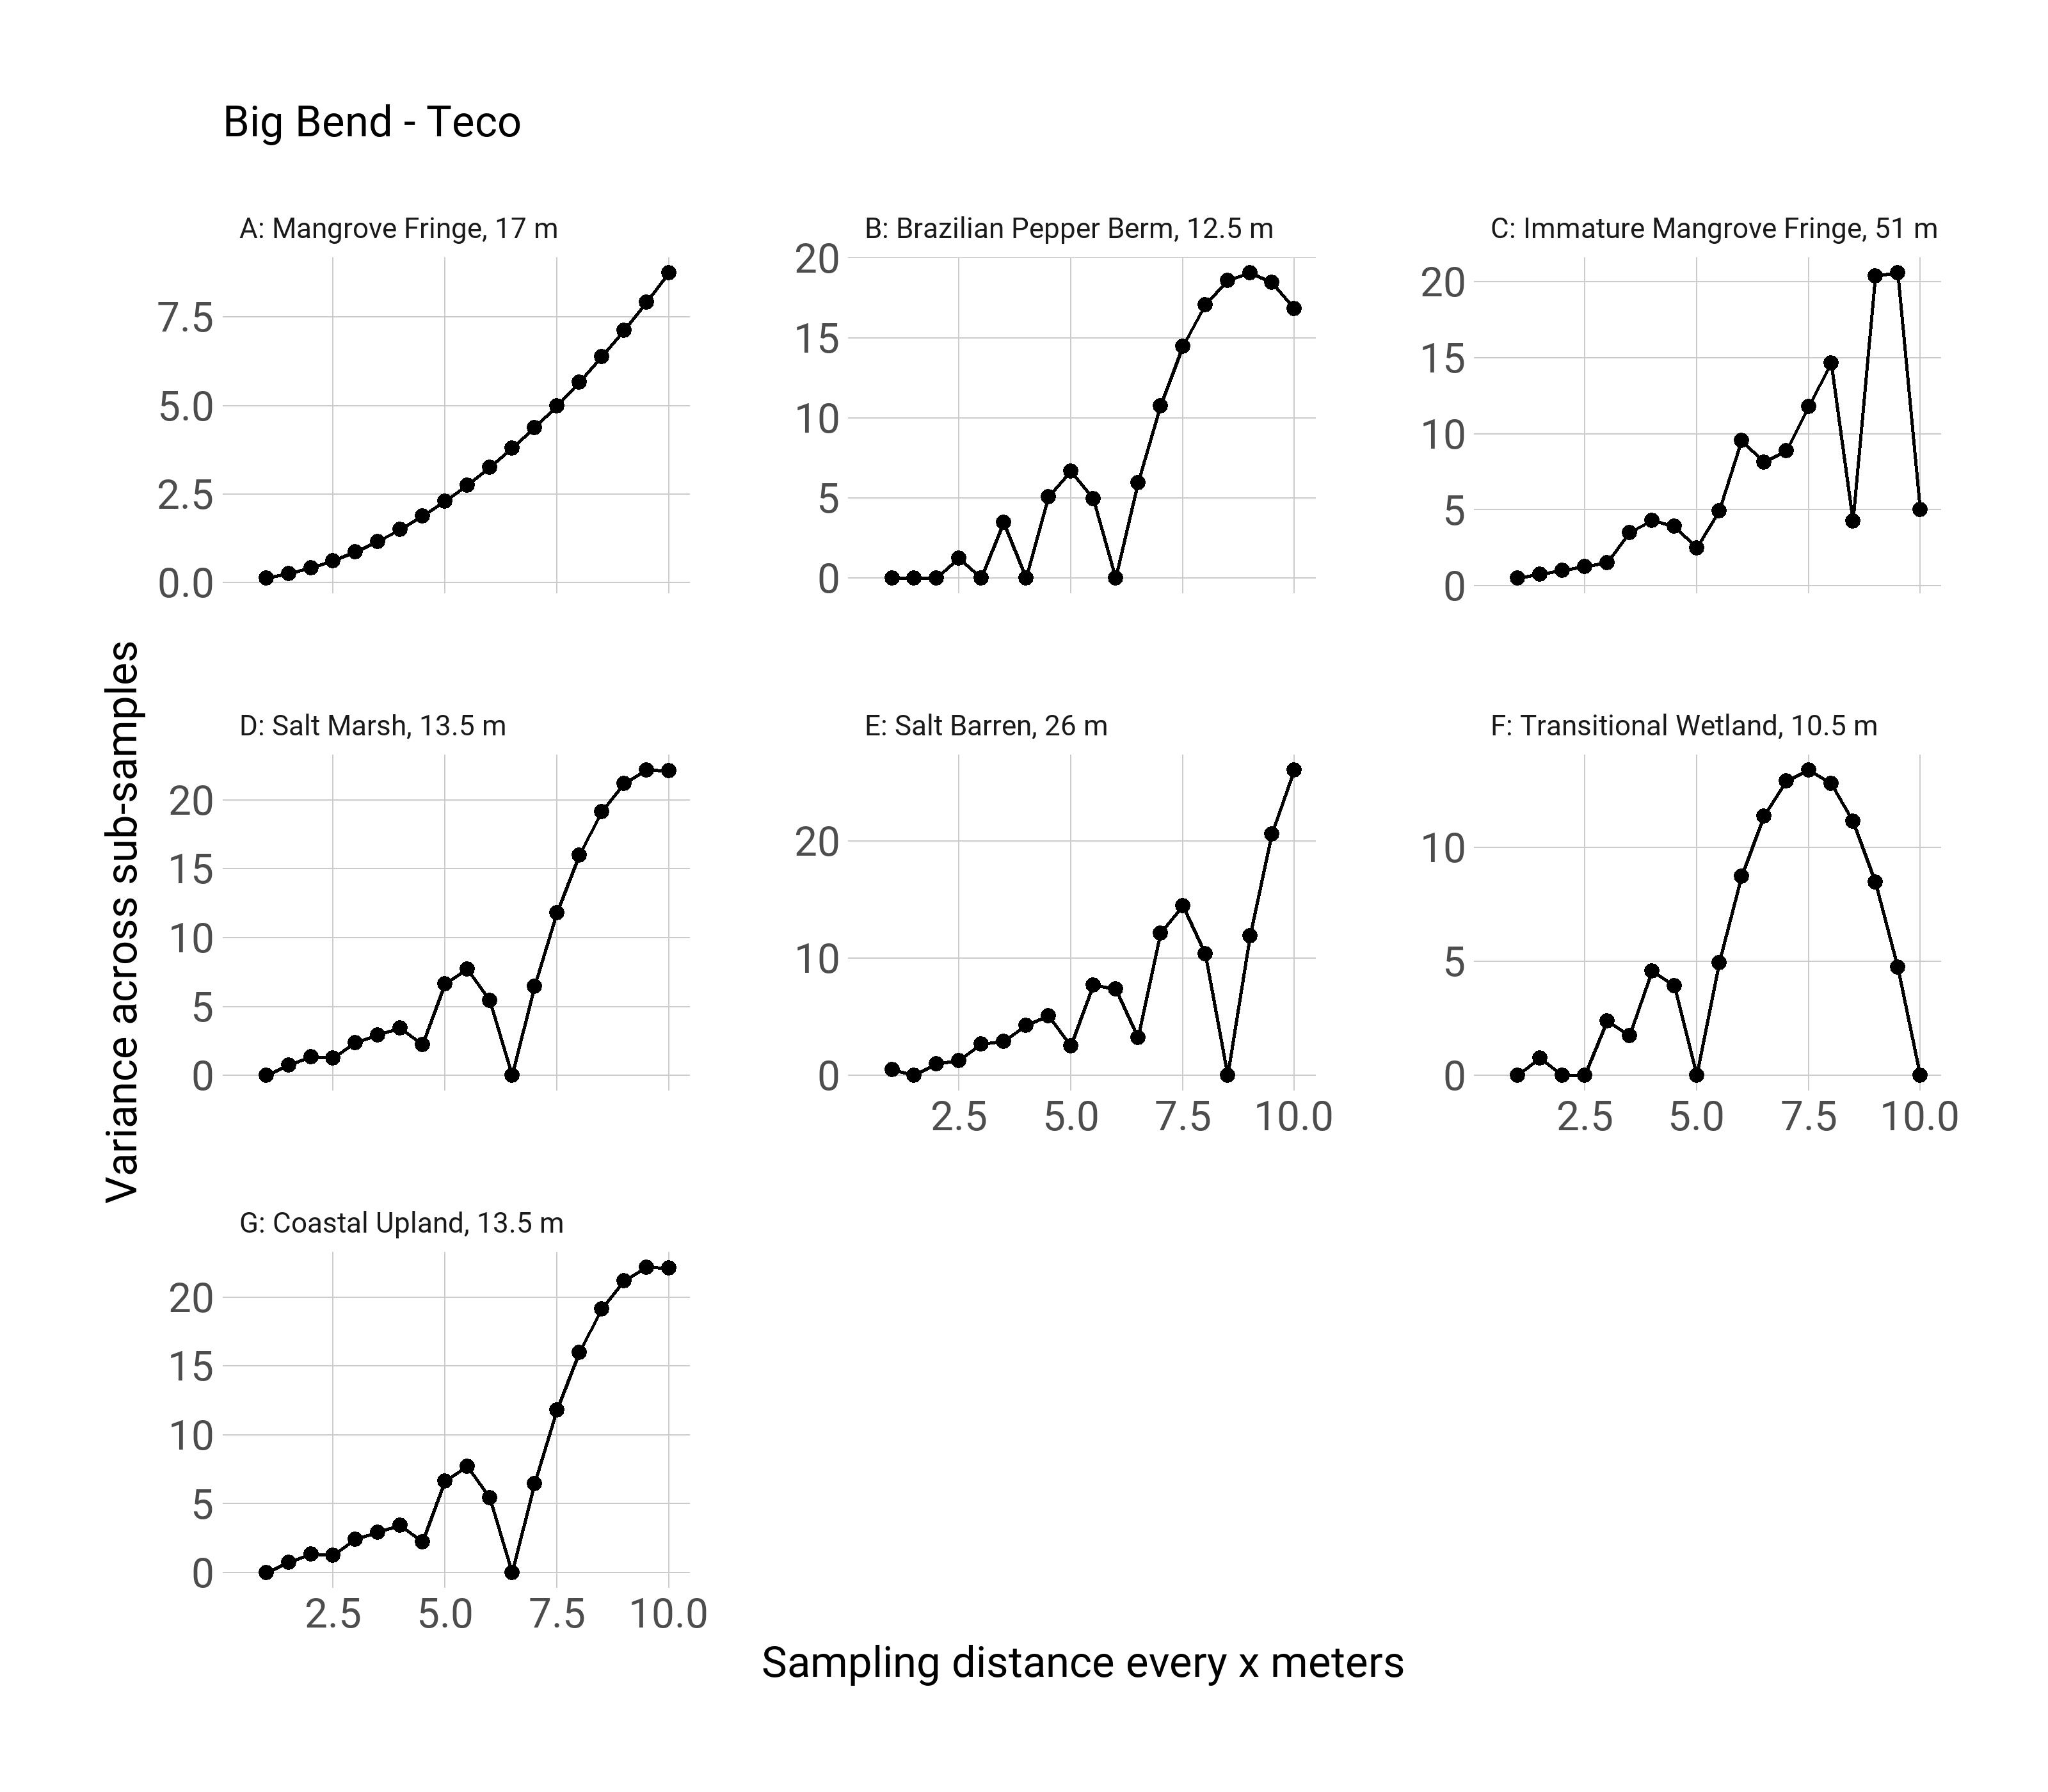
The variance (or uncertainty) of the distance estimates increases with reductions in effort, but the increase is not linear. An example for Big Bend - TECO is shown below. Although variance increase across the zones, the variance estimates fall to zero when the actual zone distance (facet label shown in meters) is divisible by the sample interval with no remainder. Points of maximum variance are between intervals with no remainder.
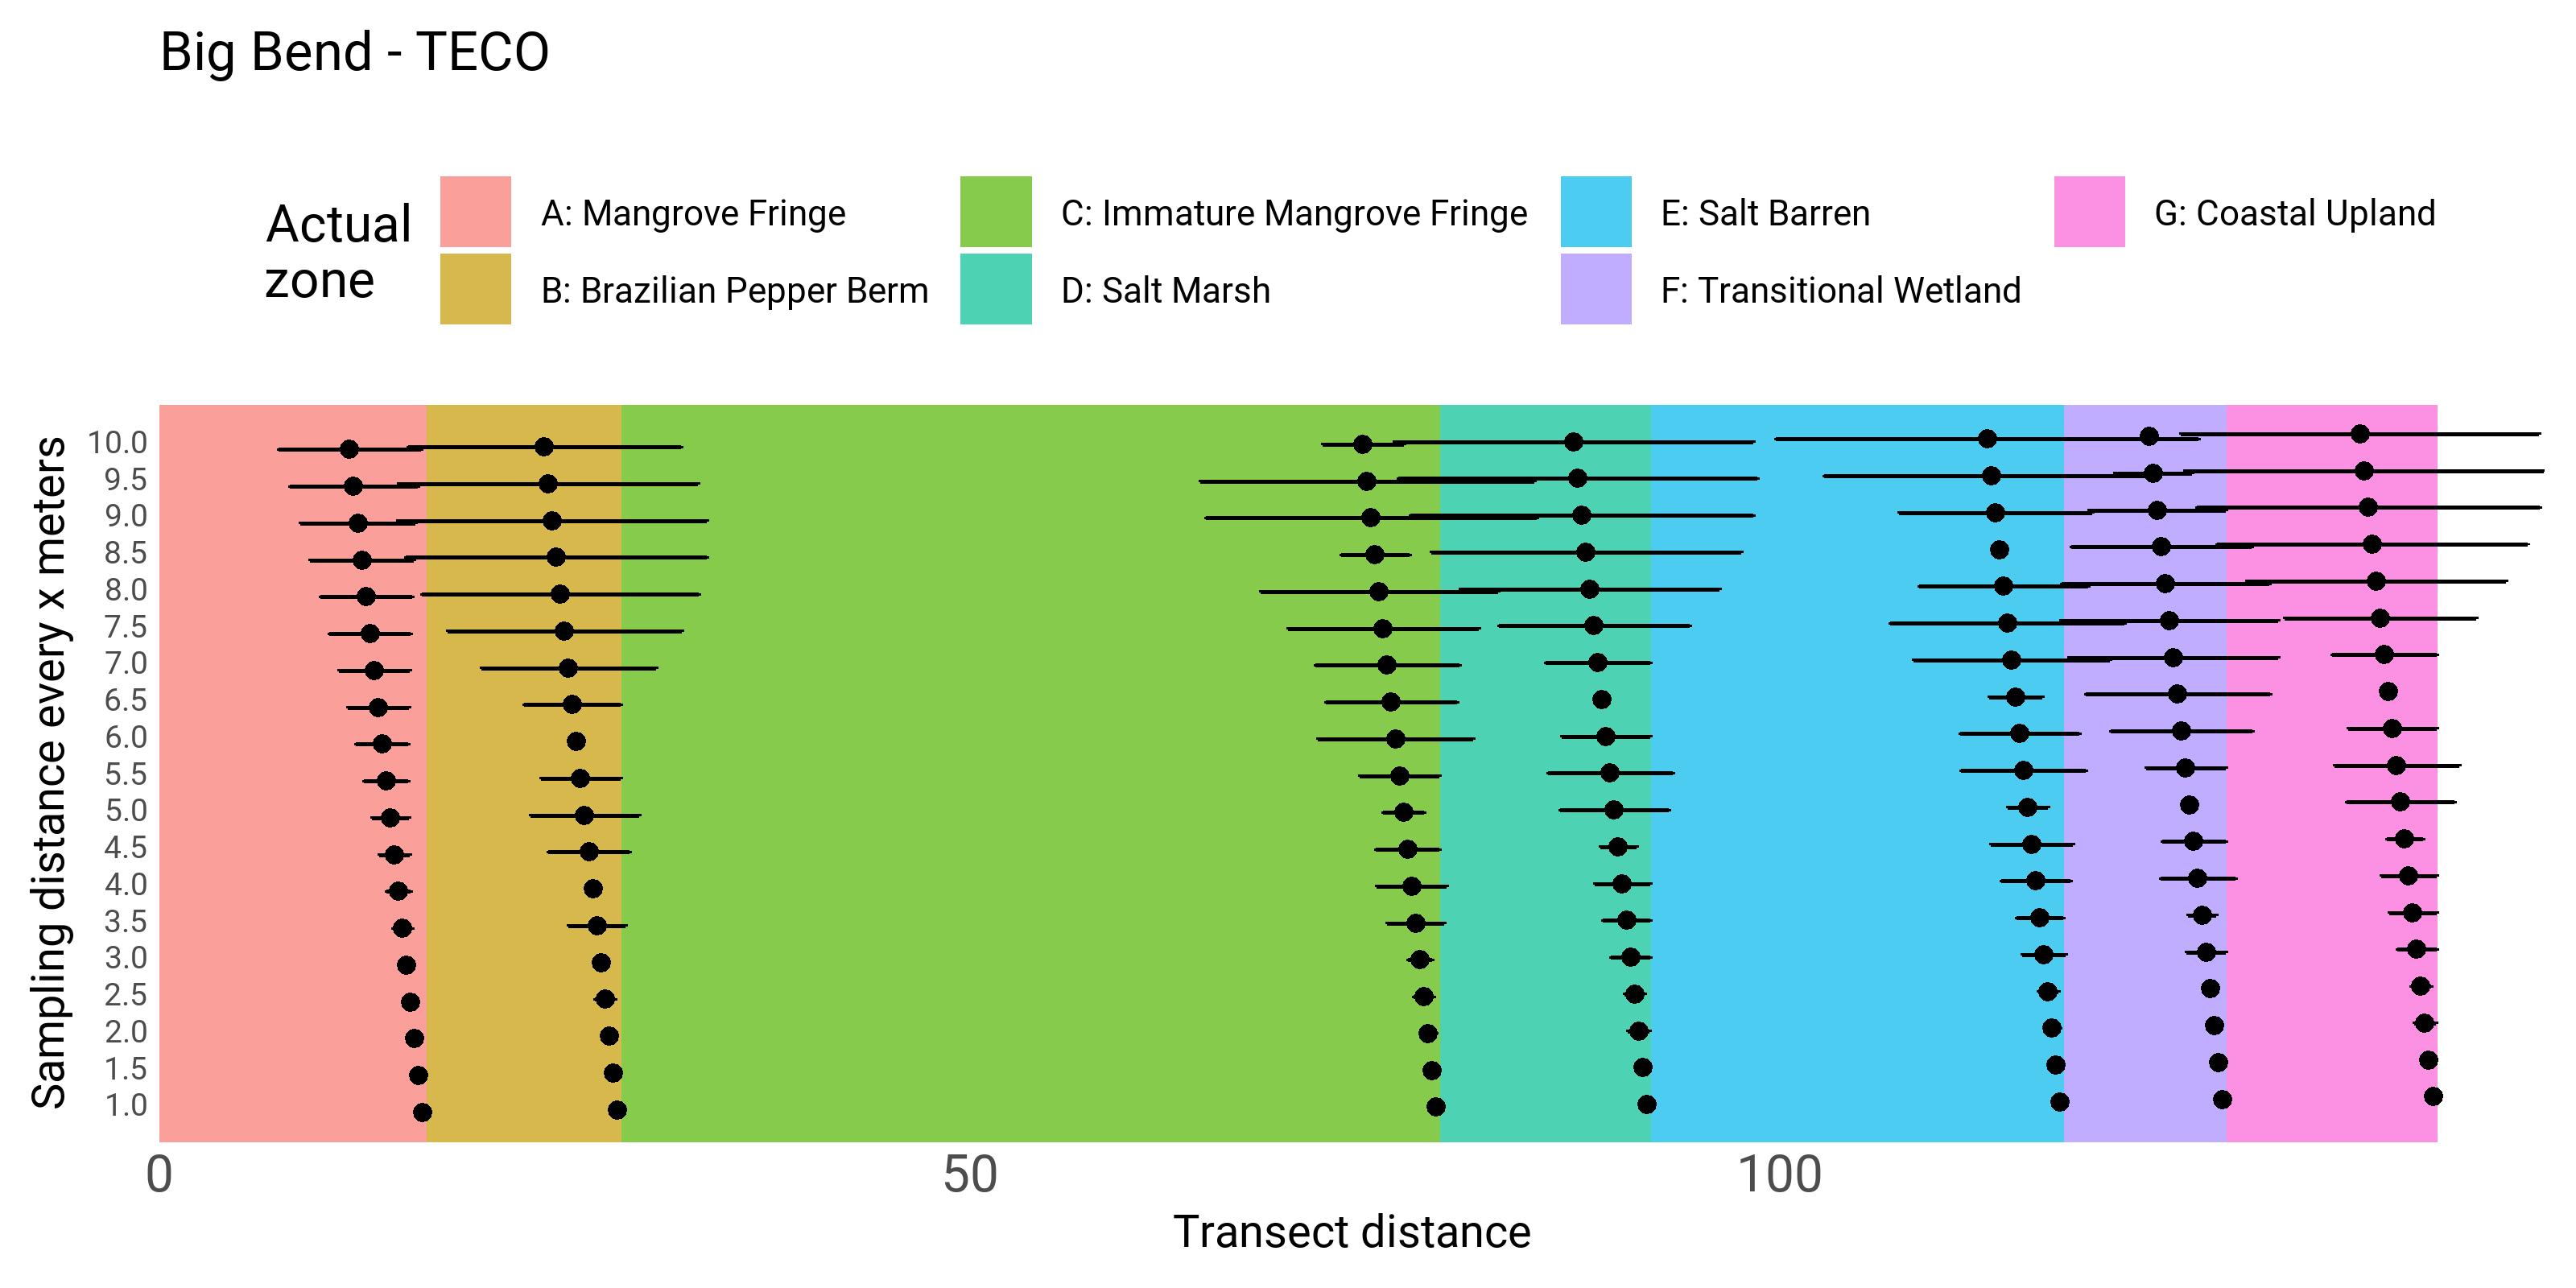
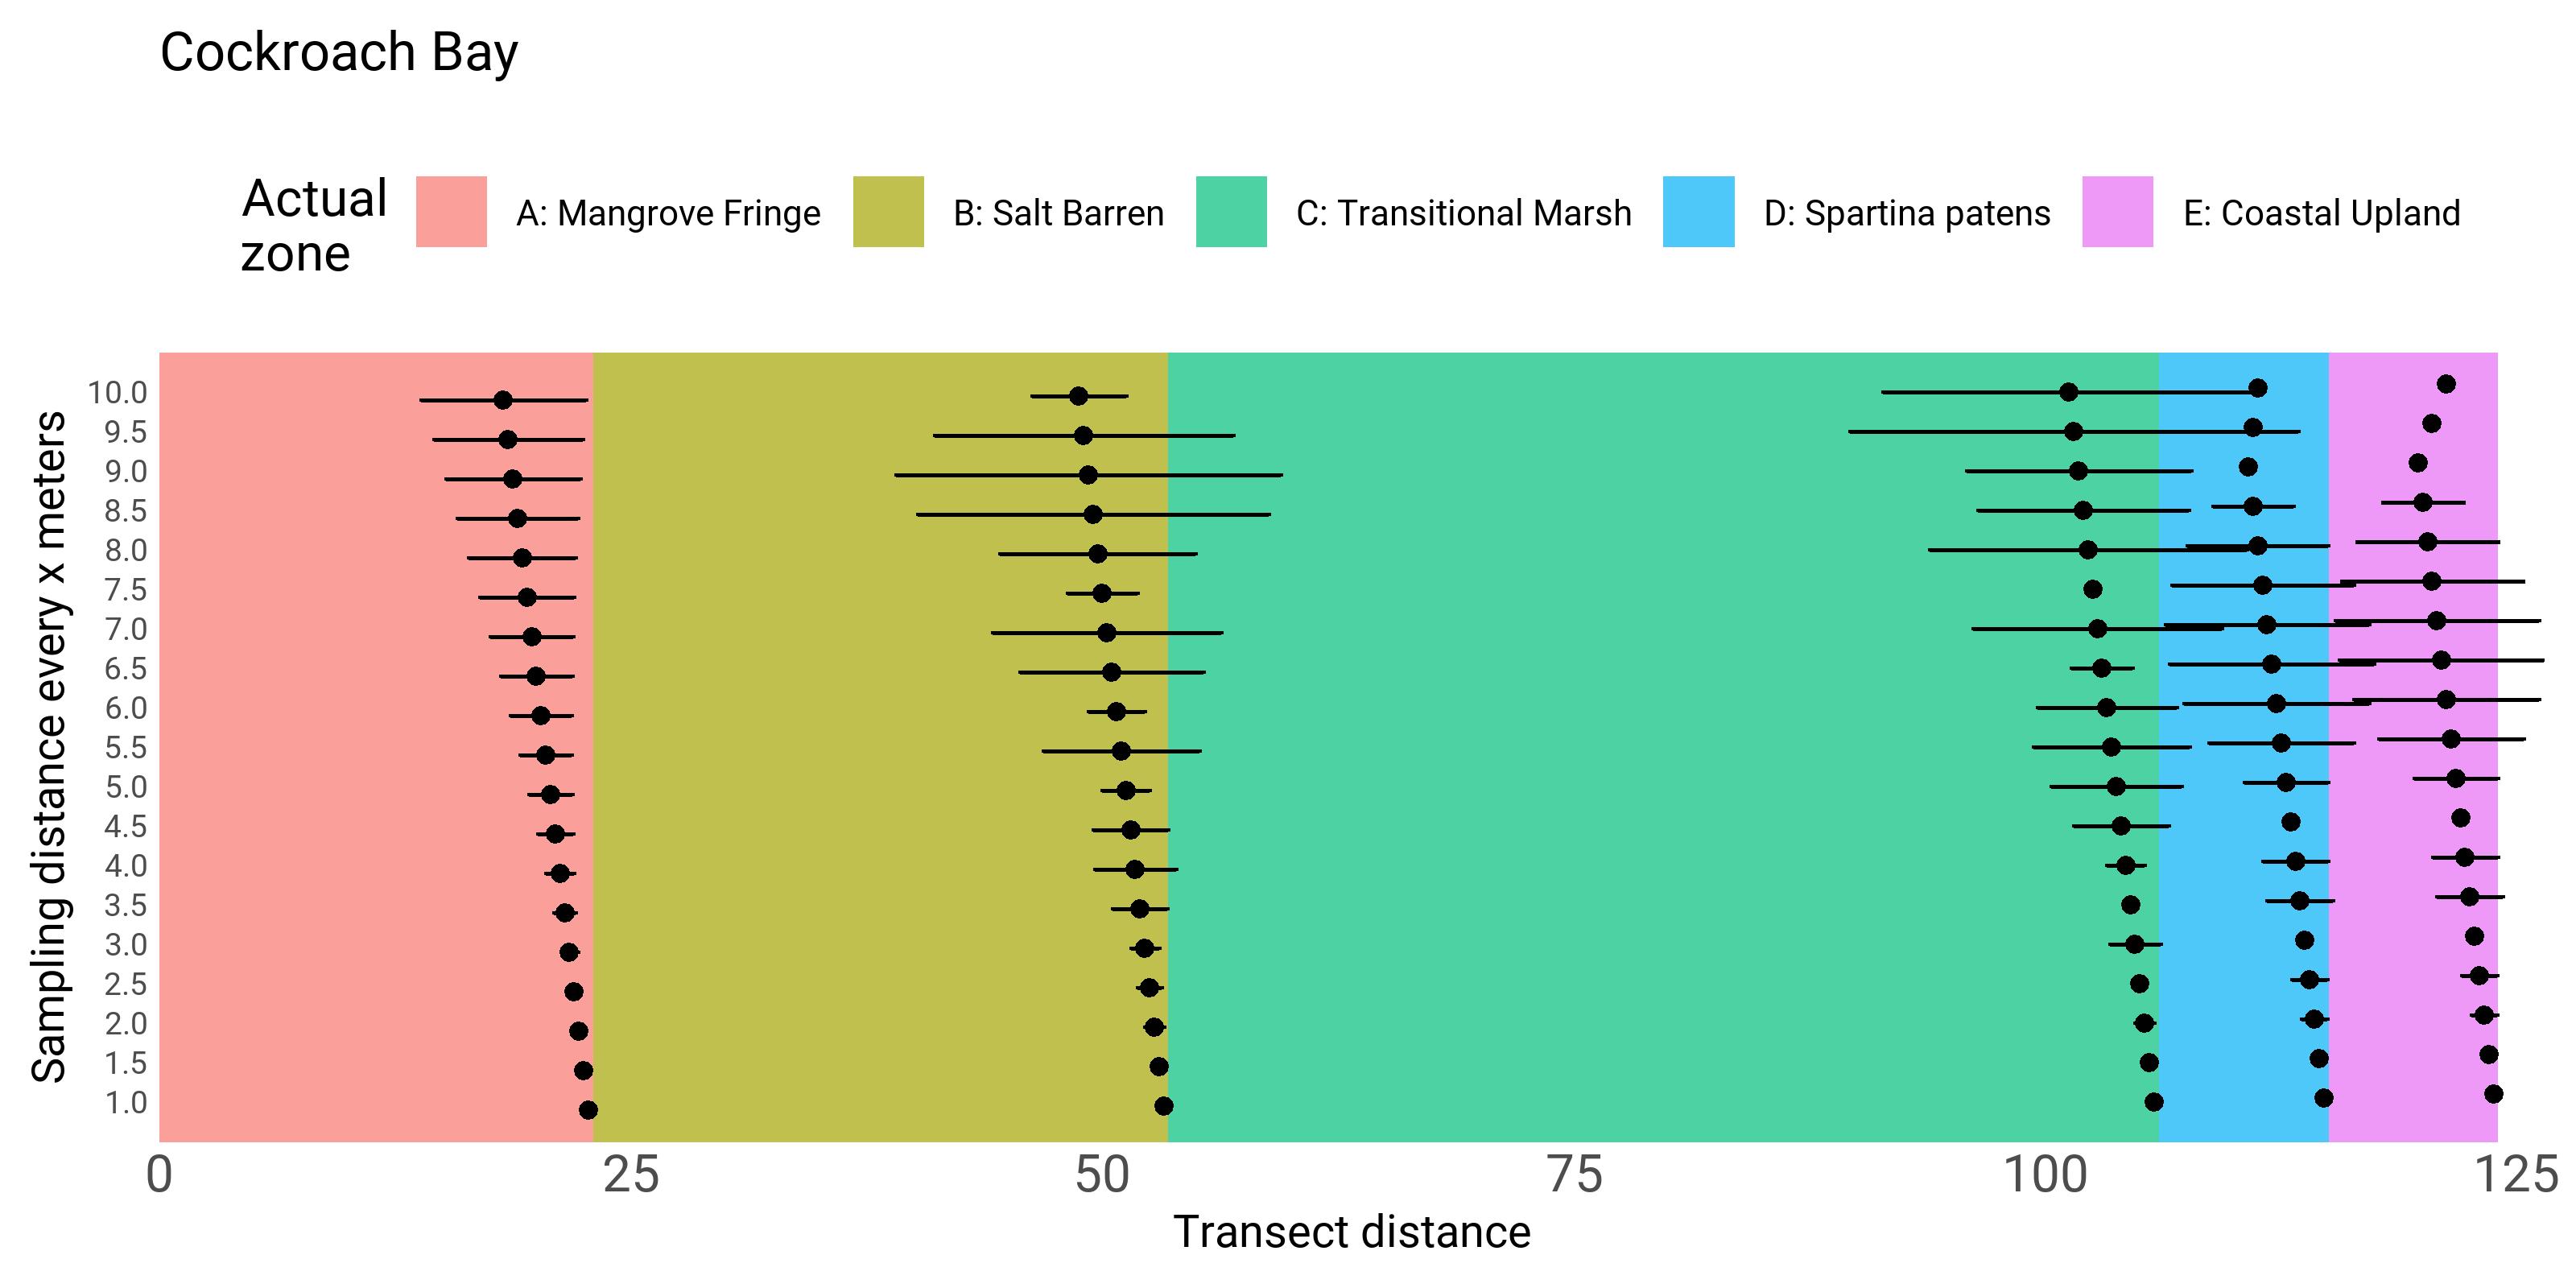
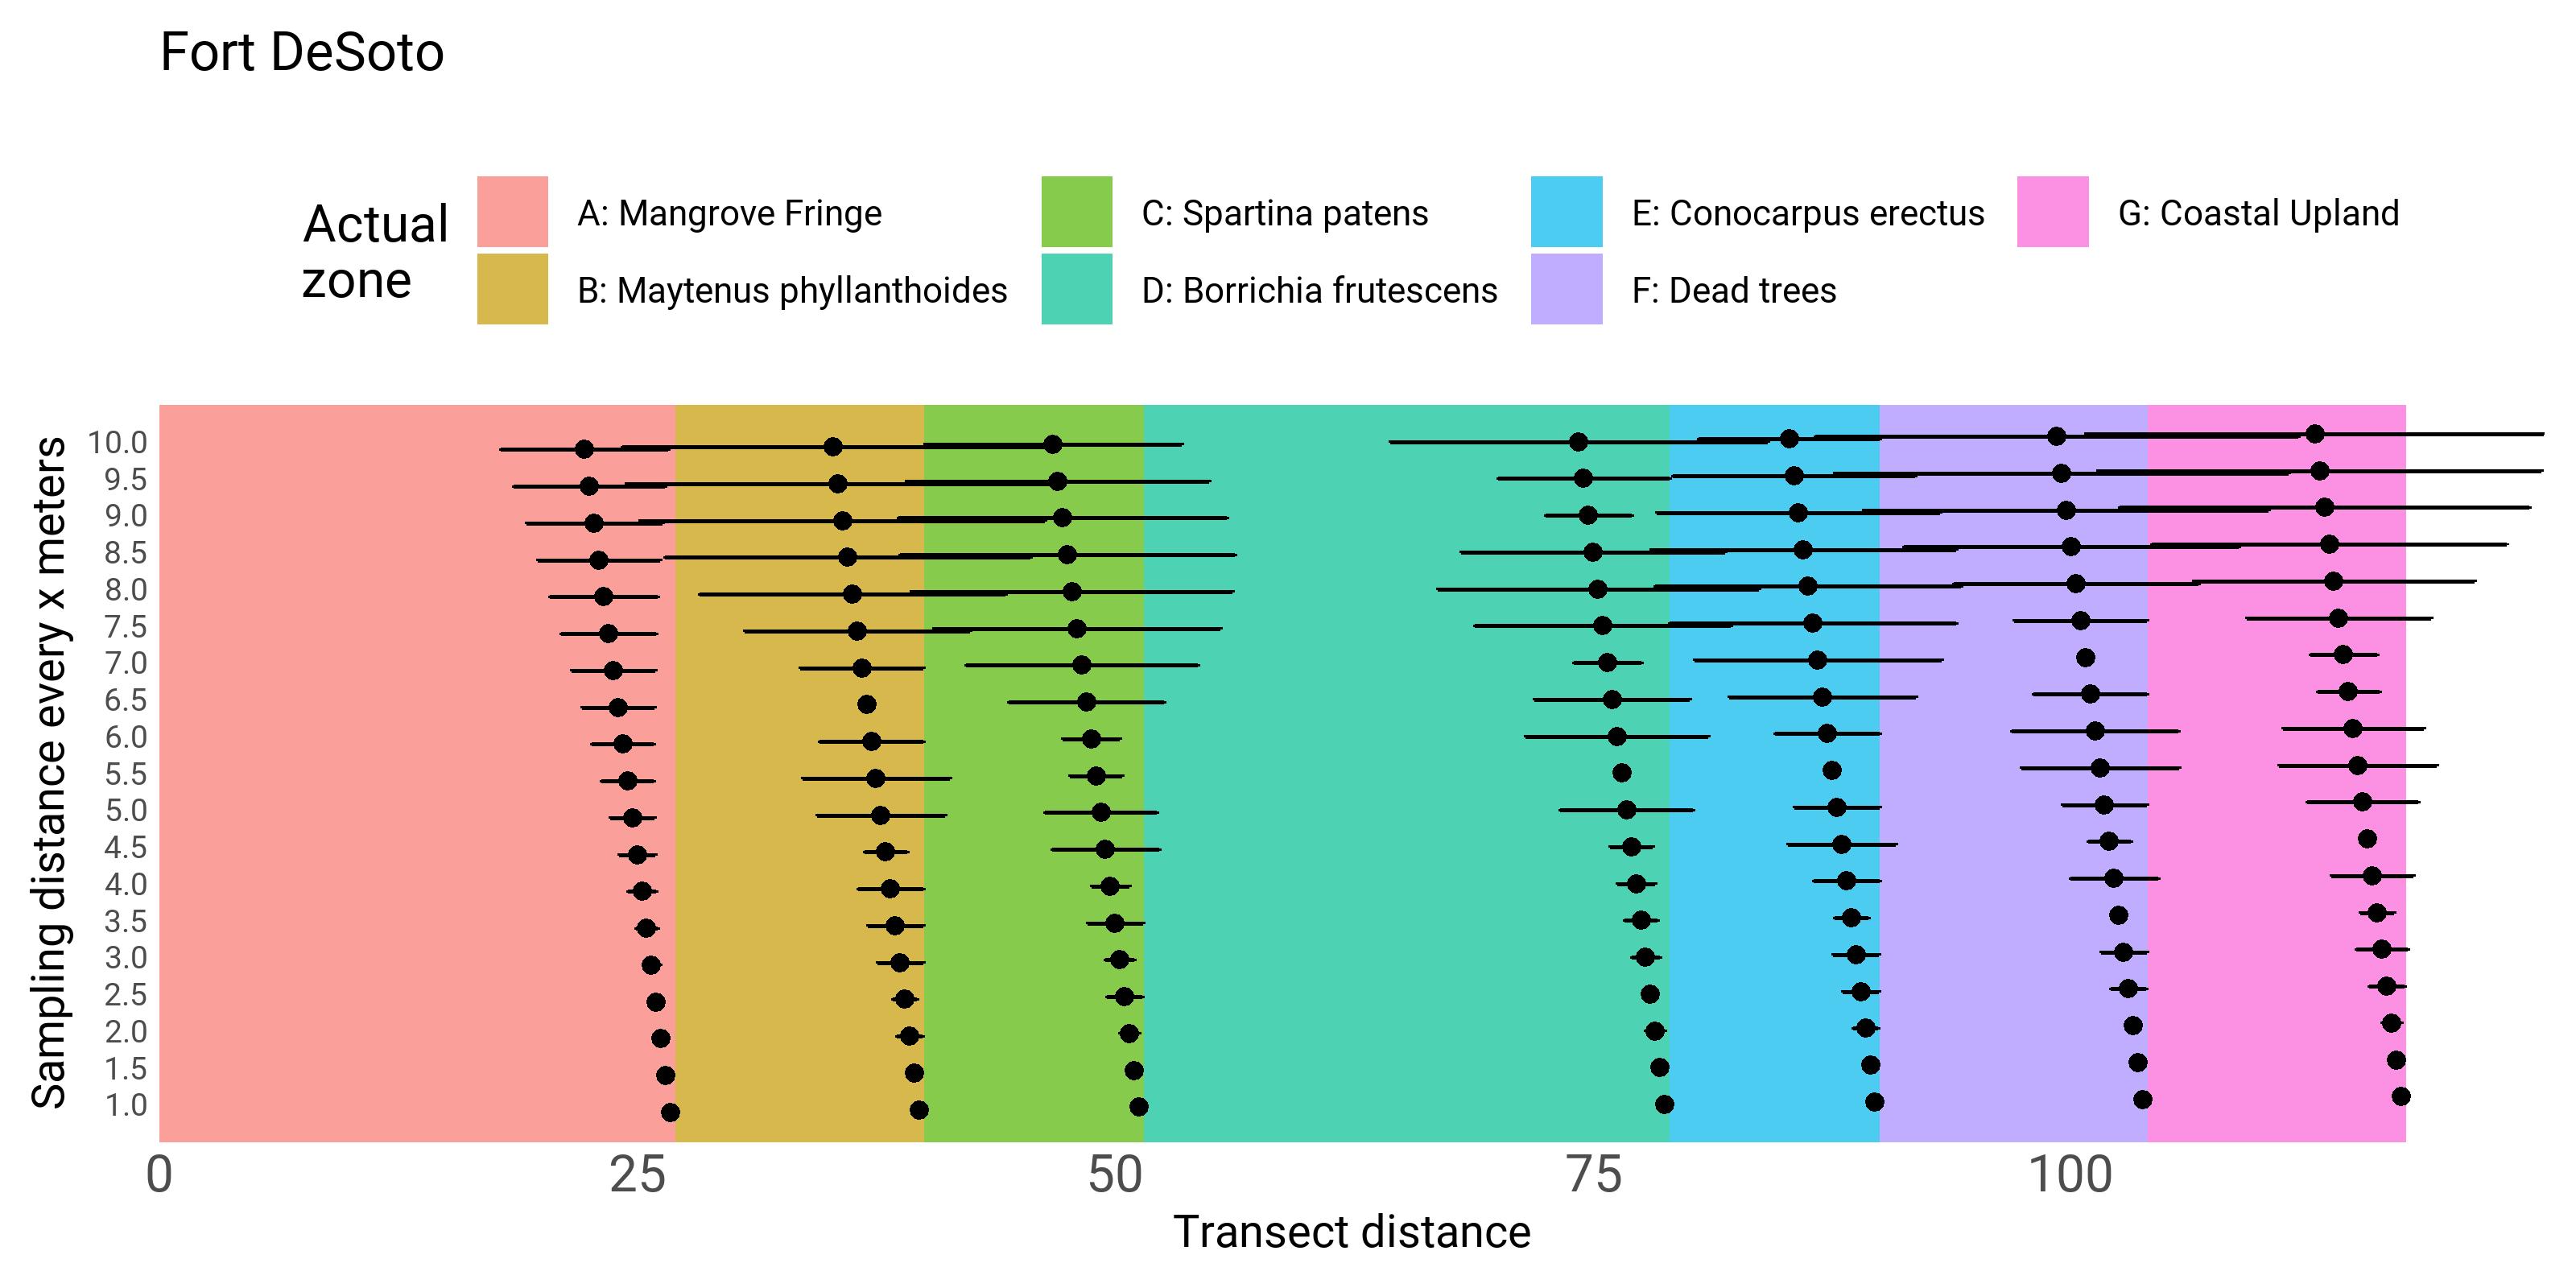
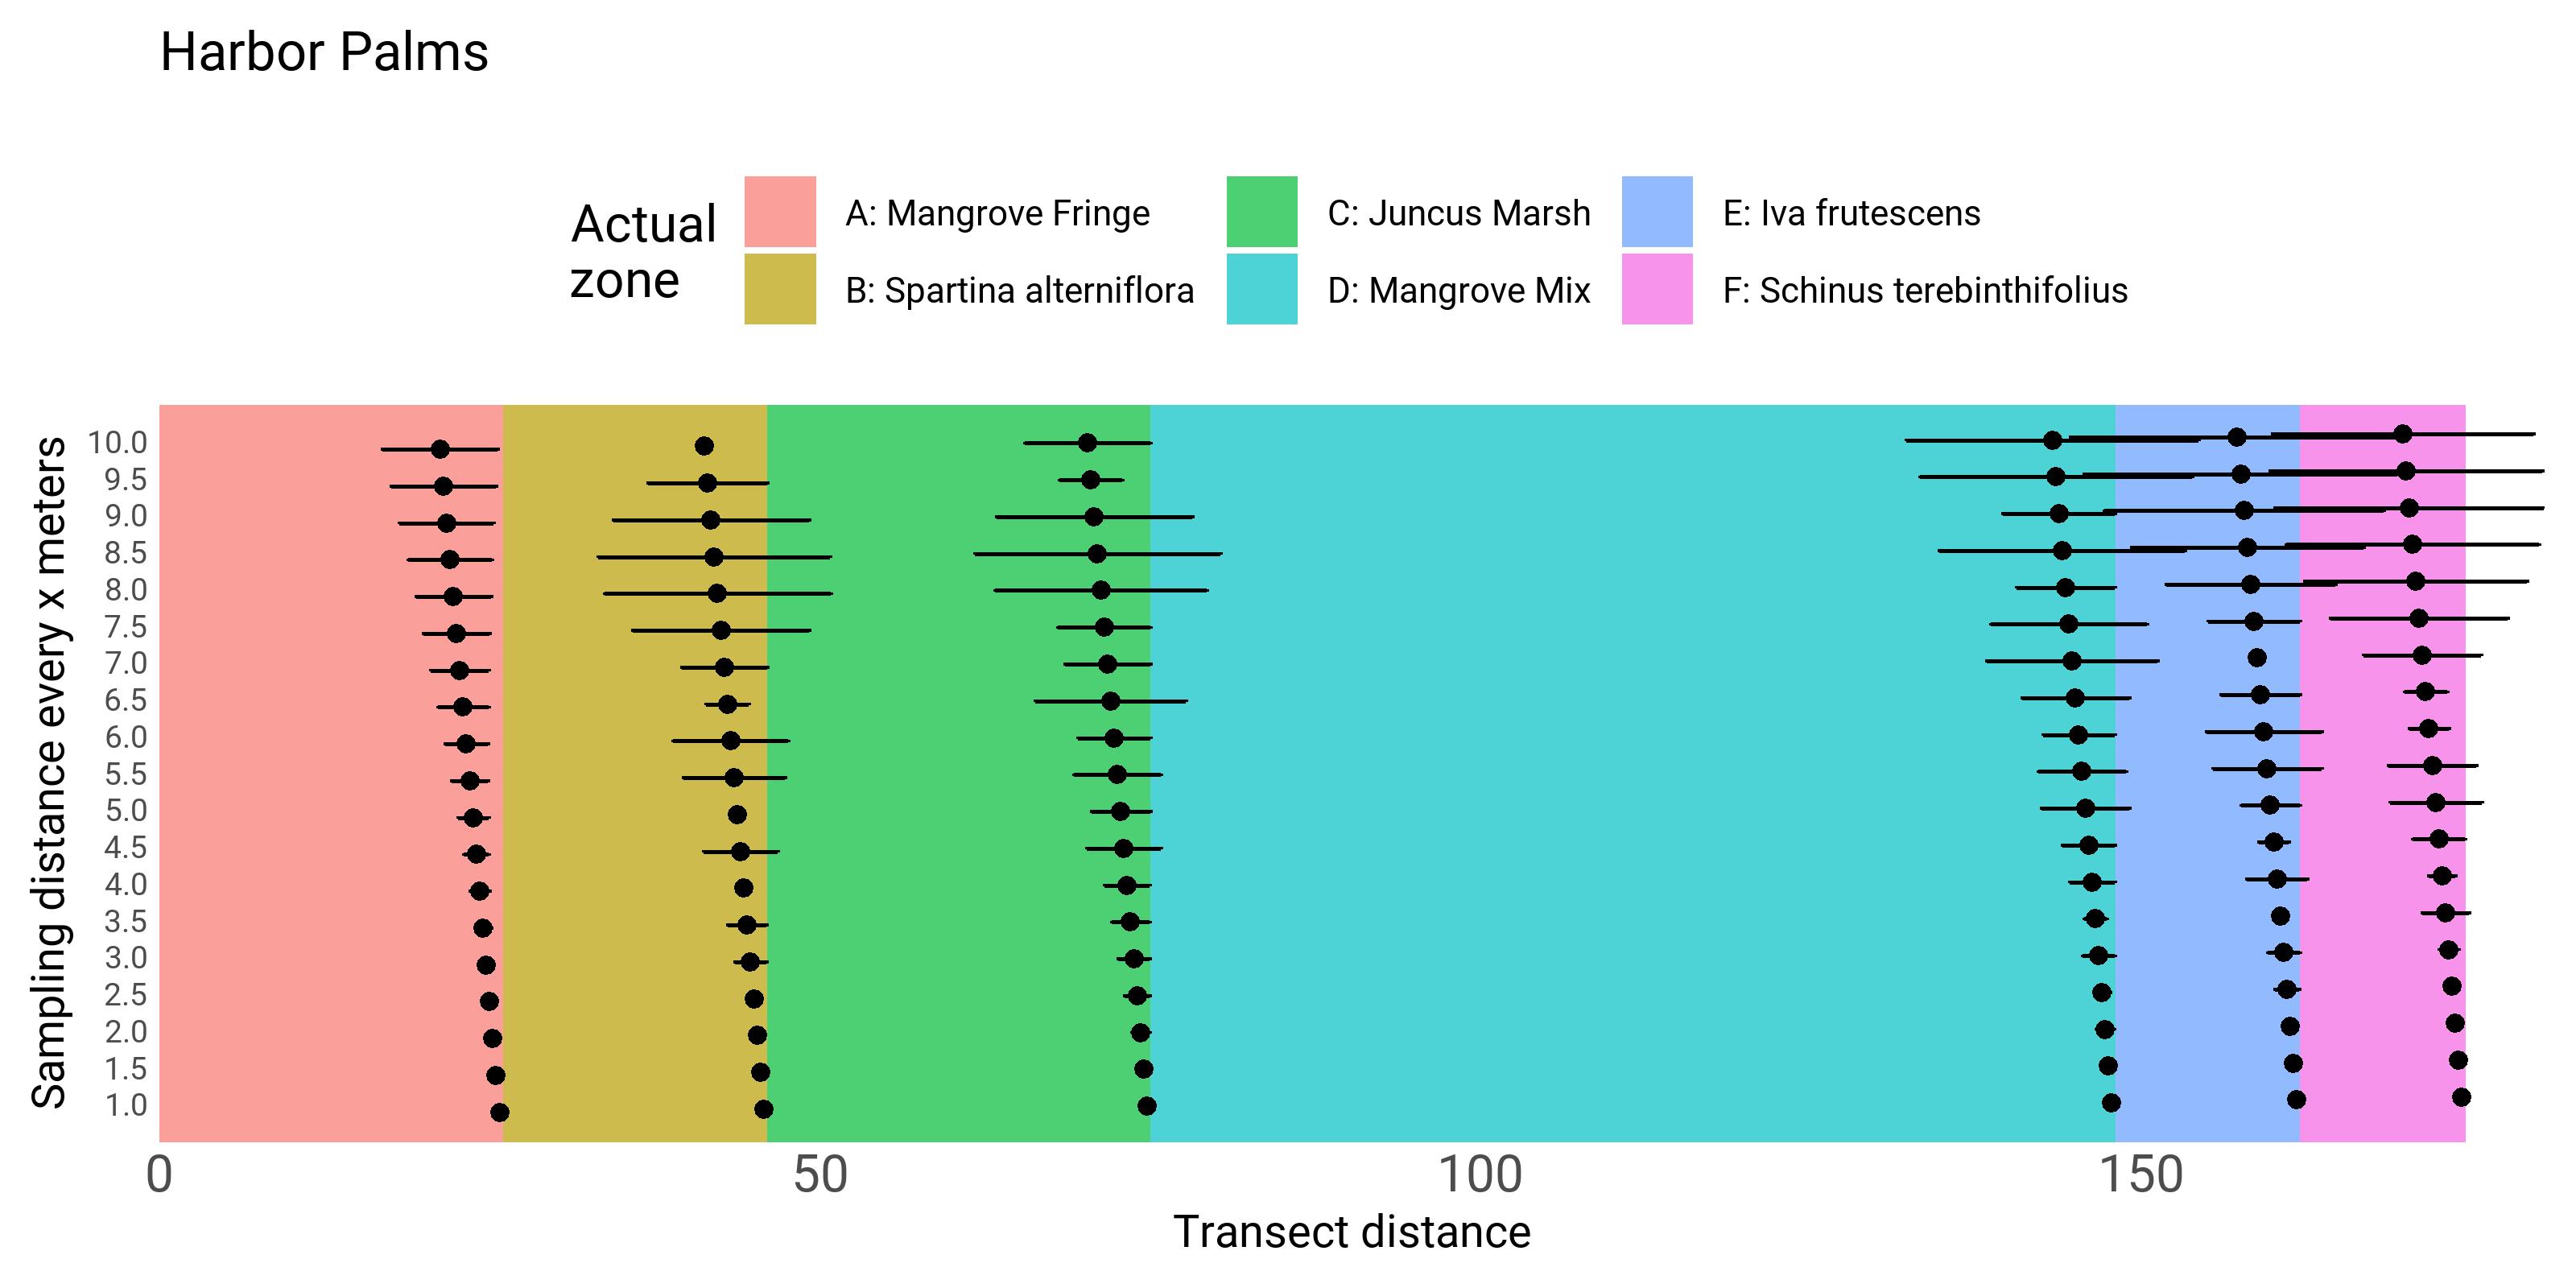
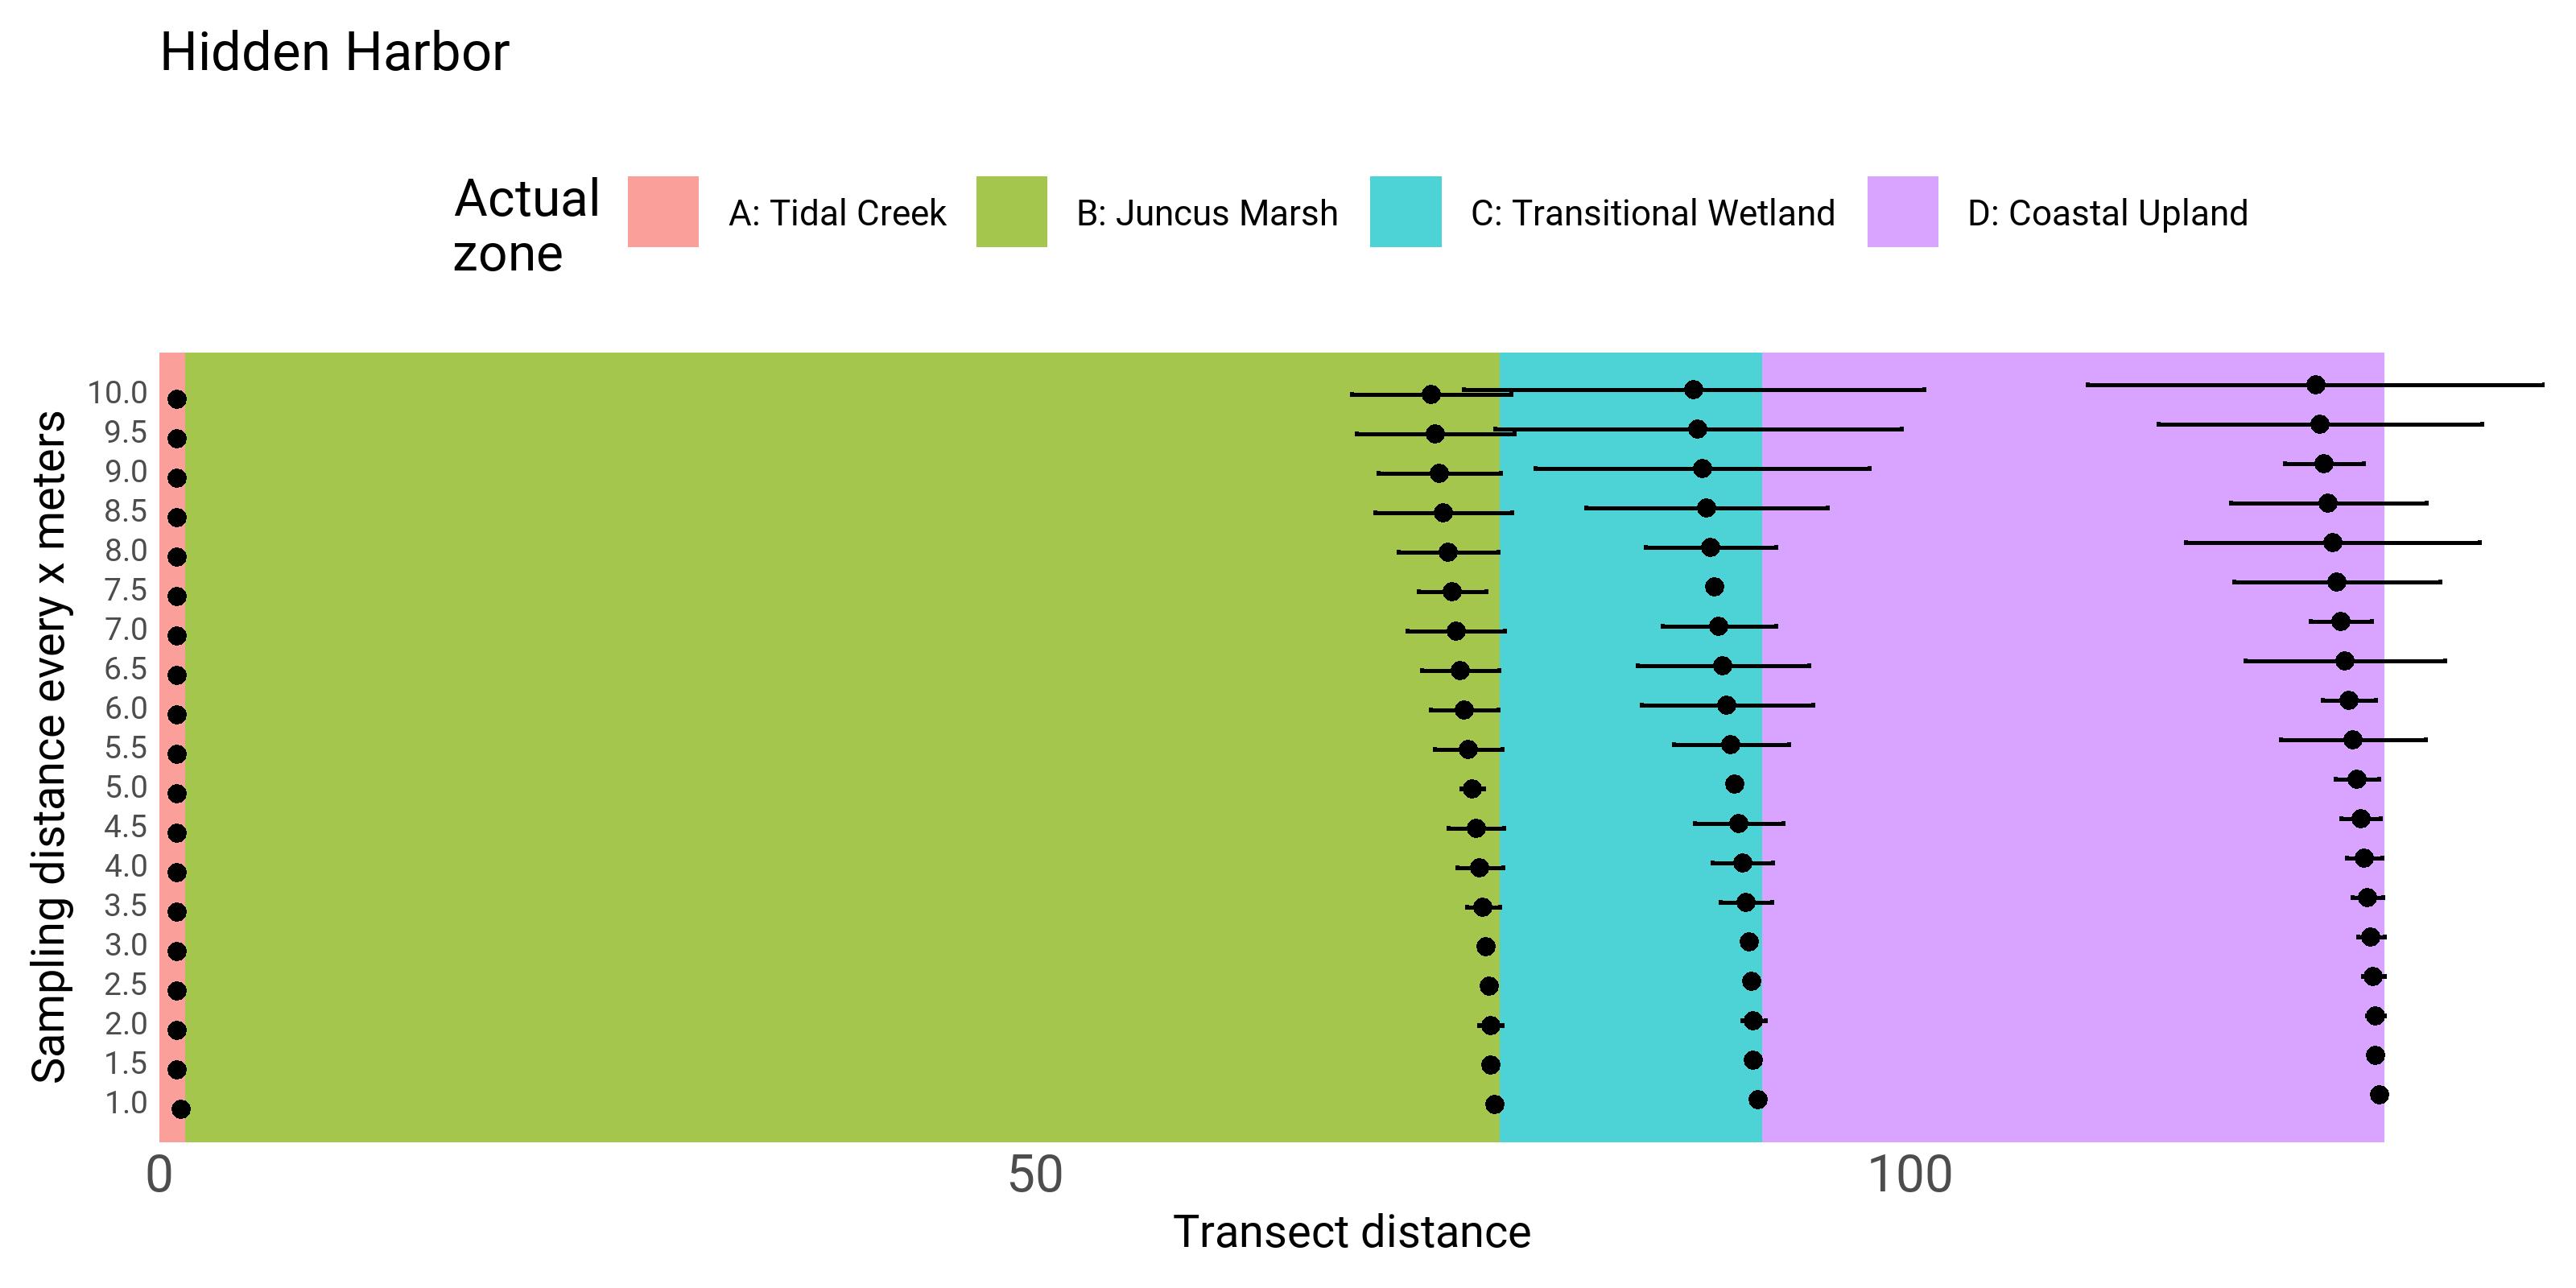
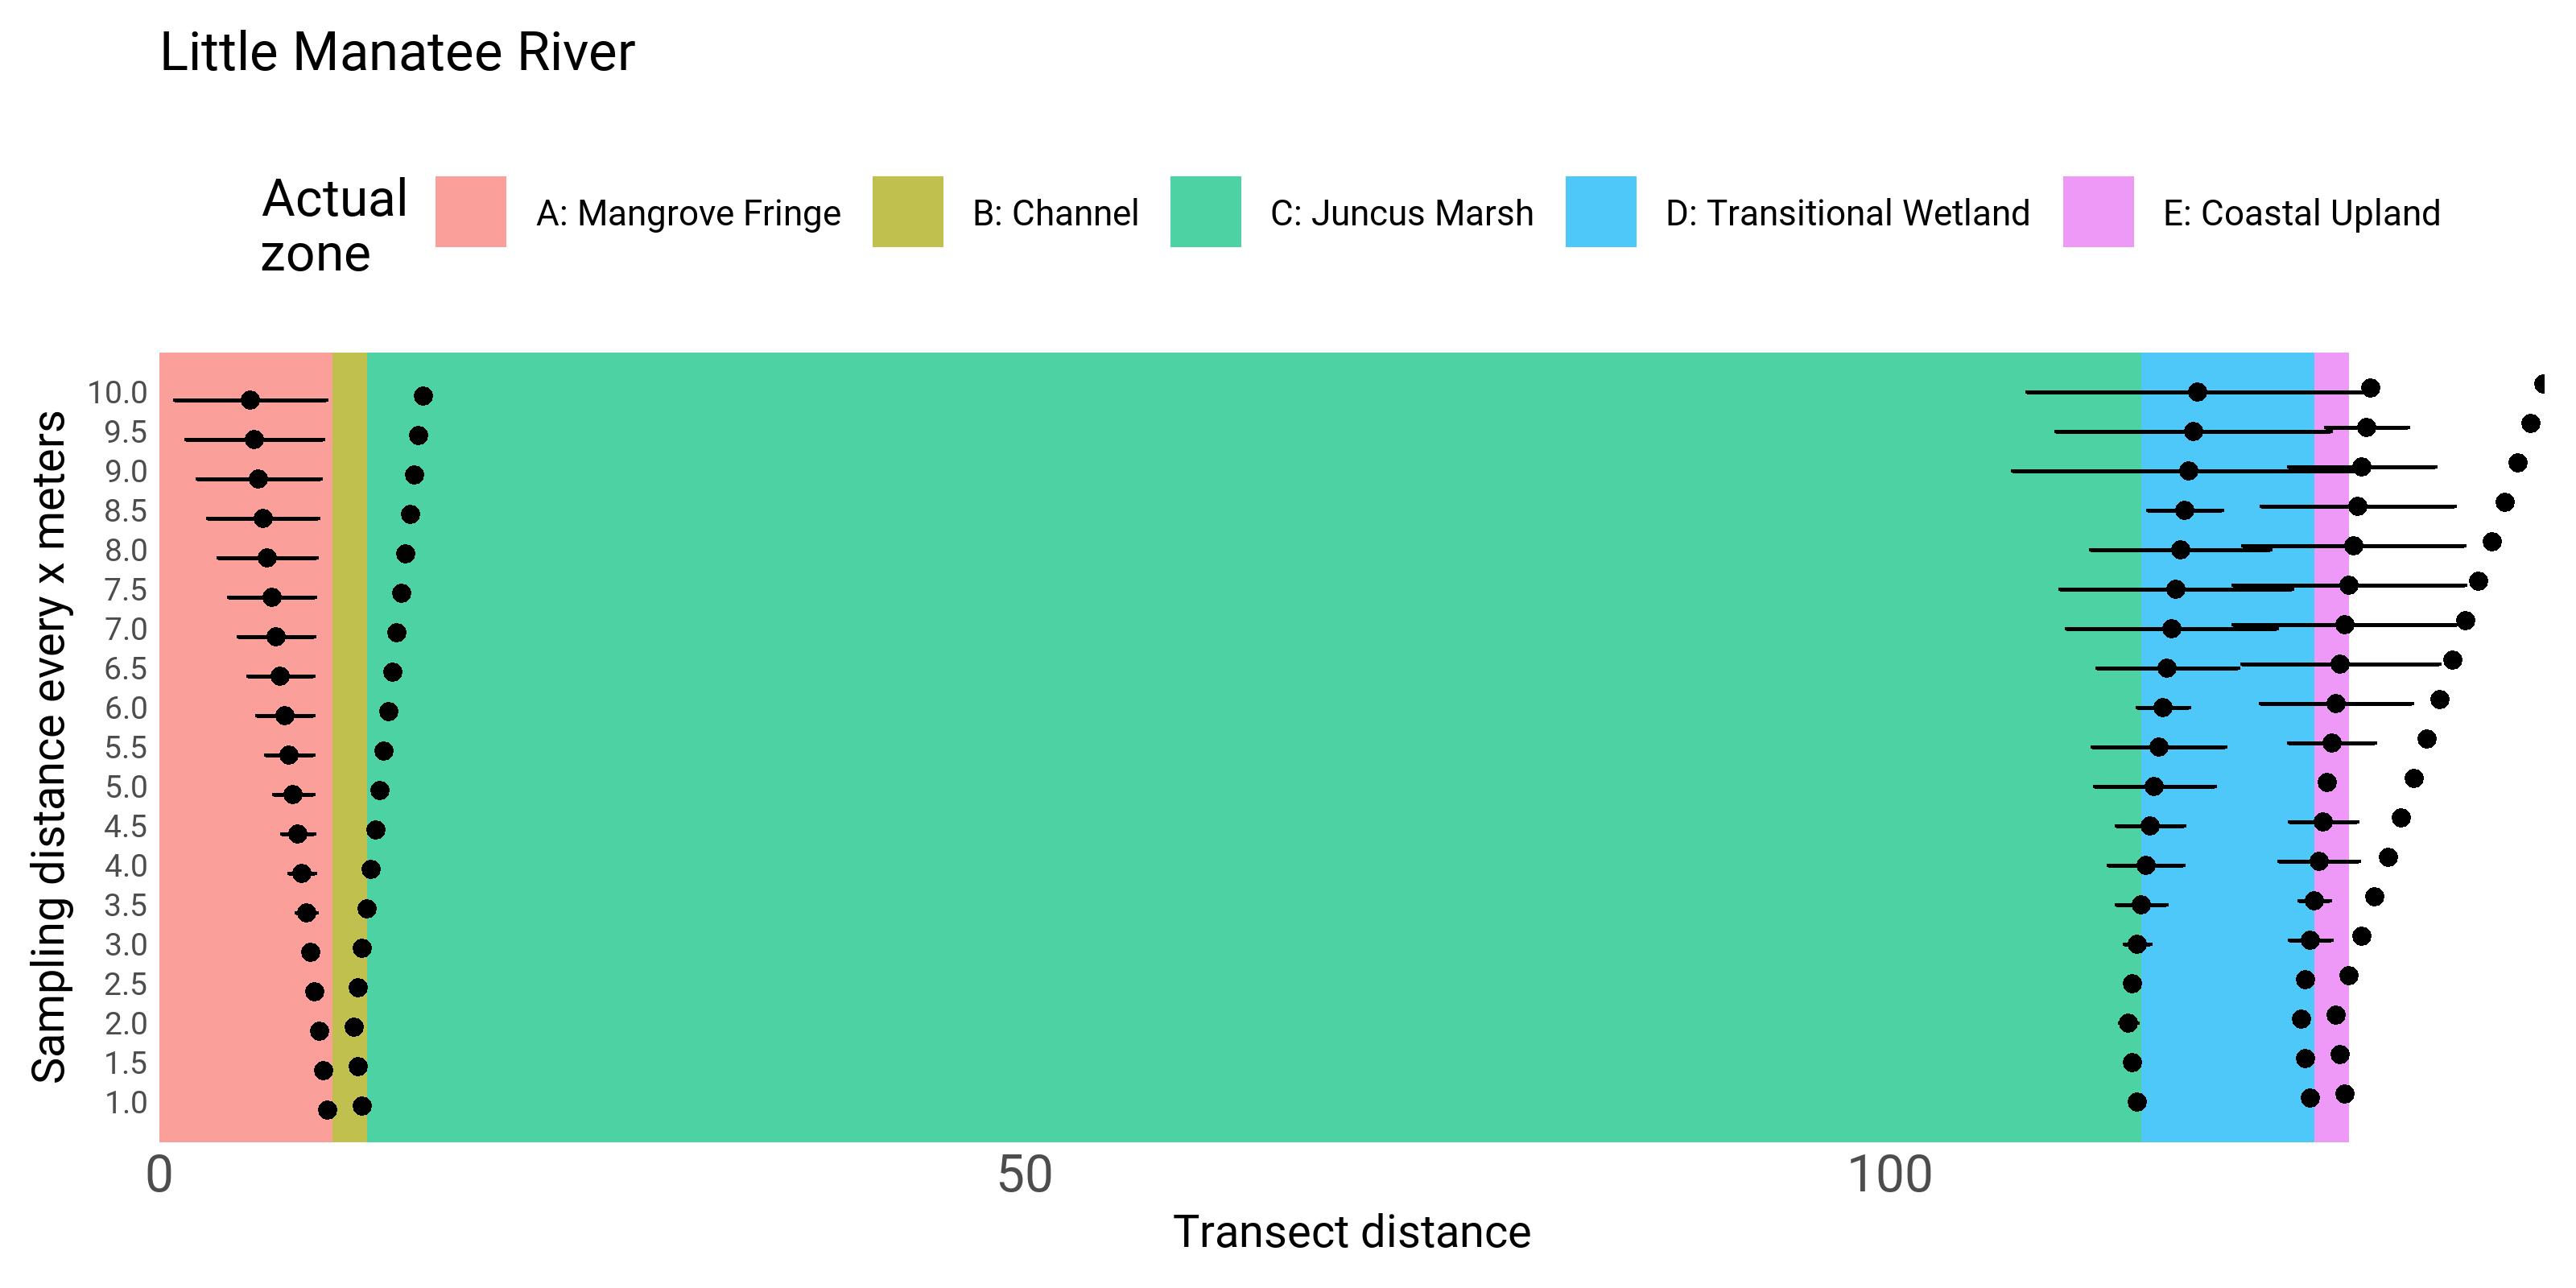
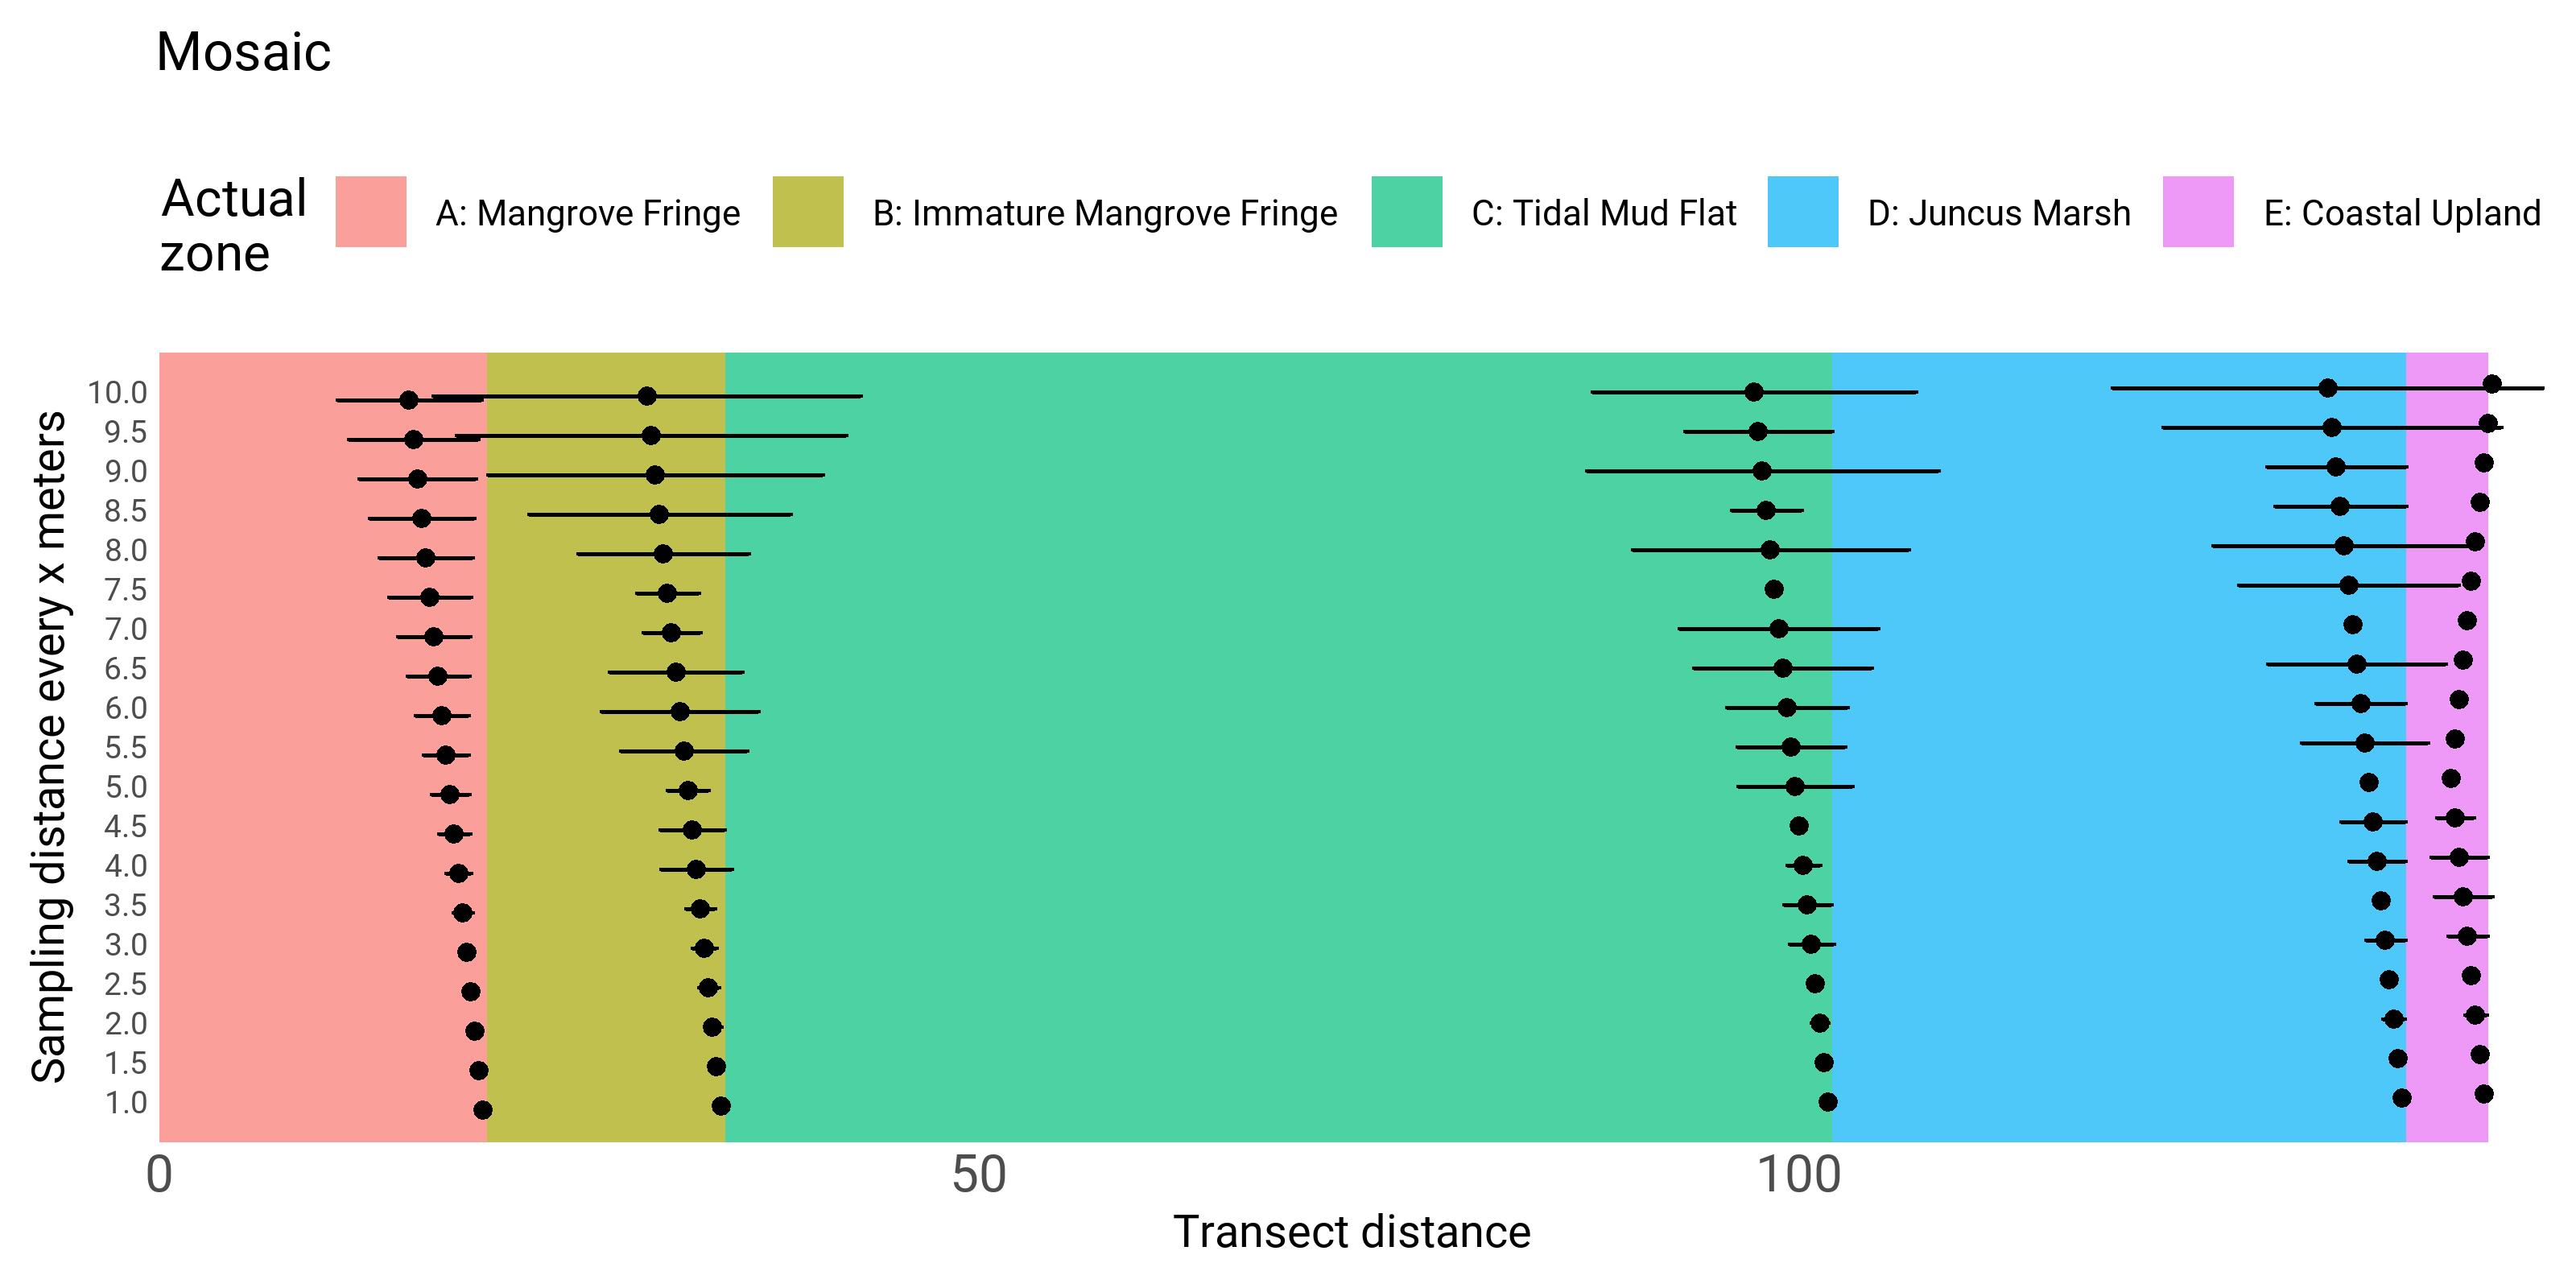
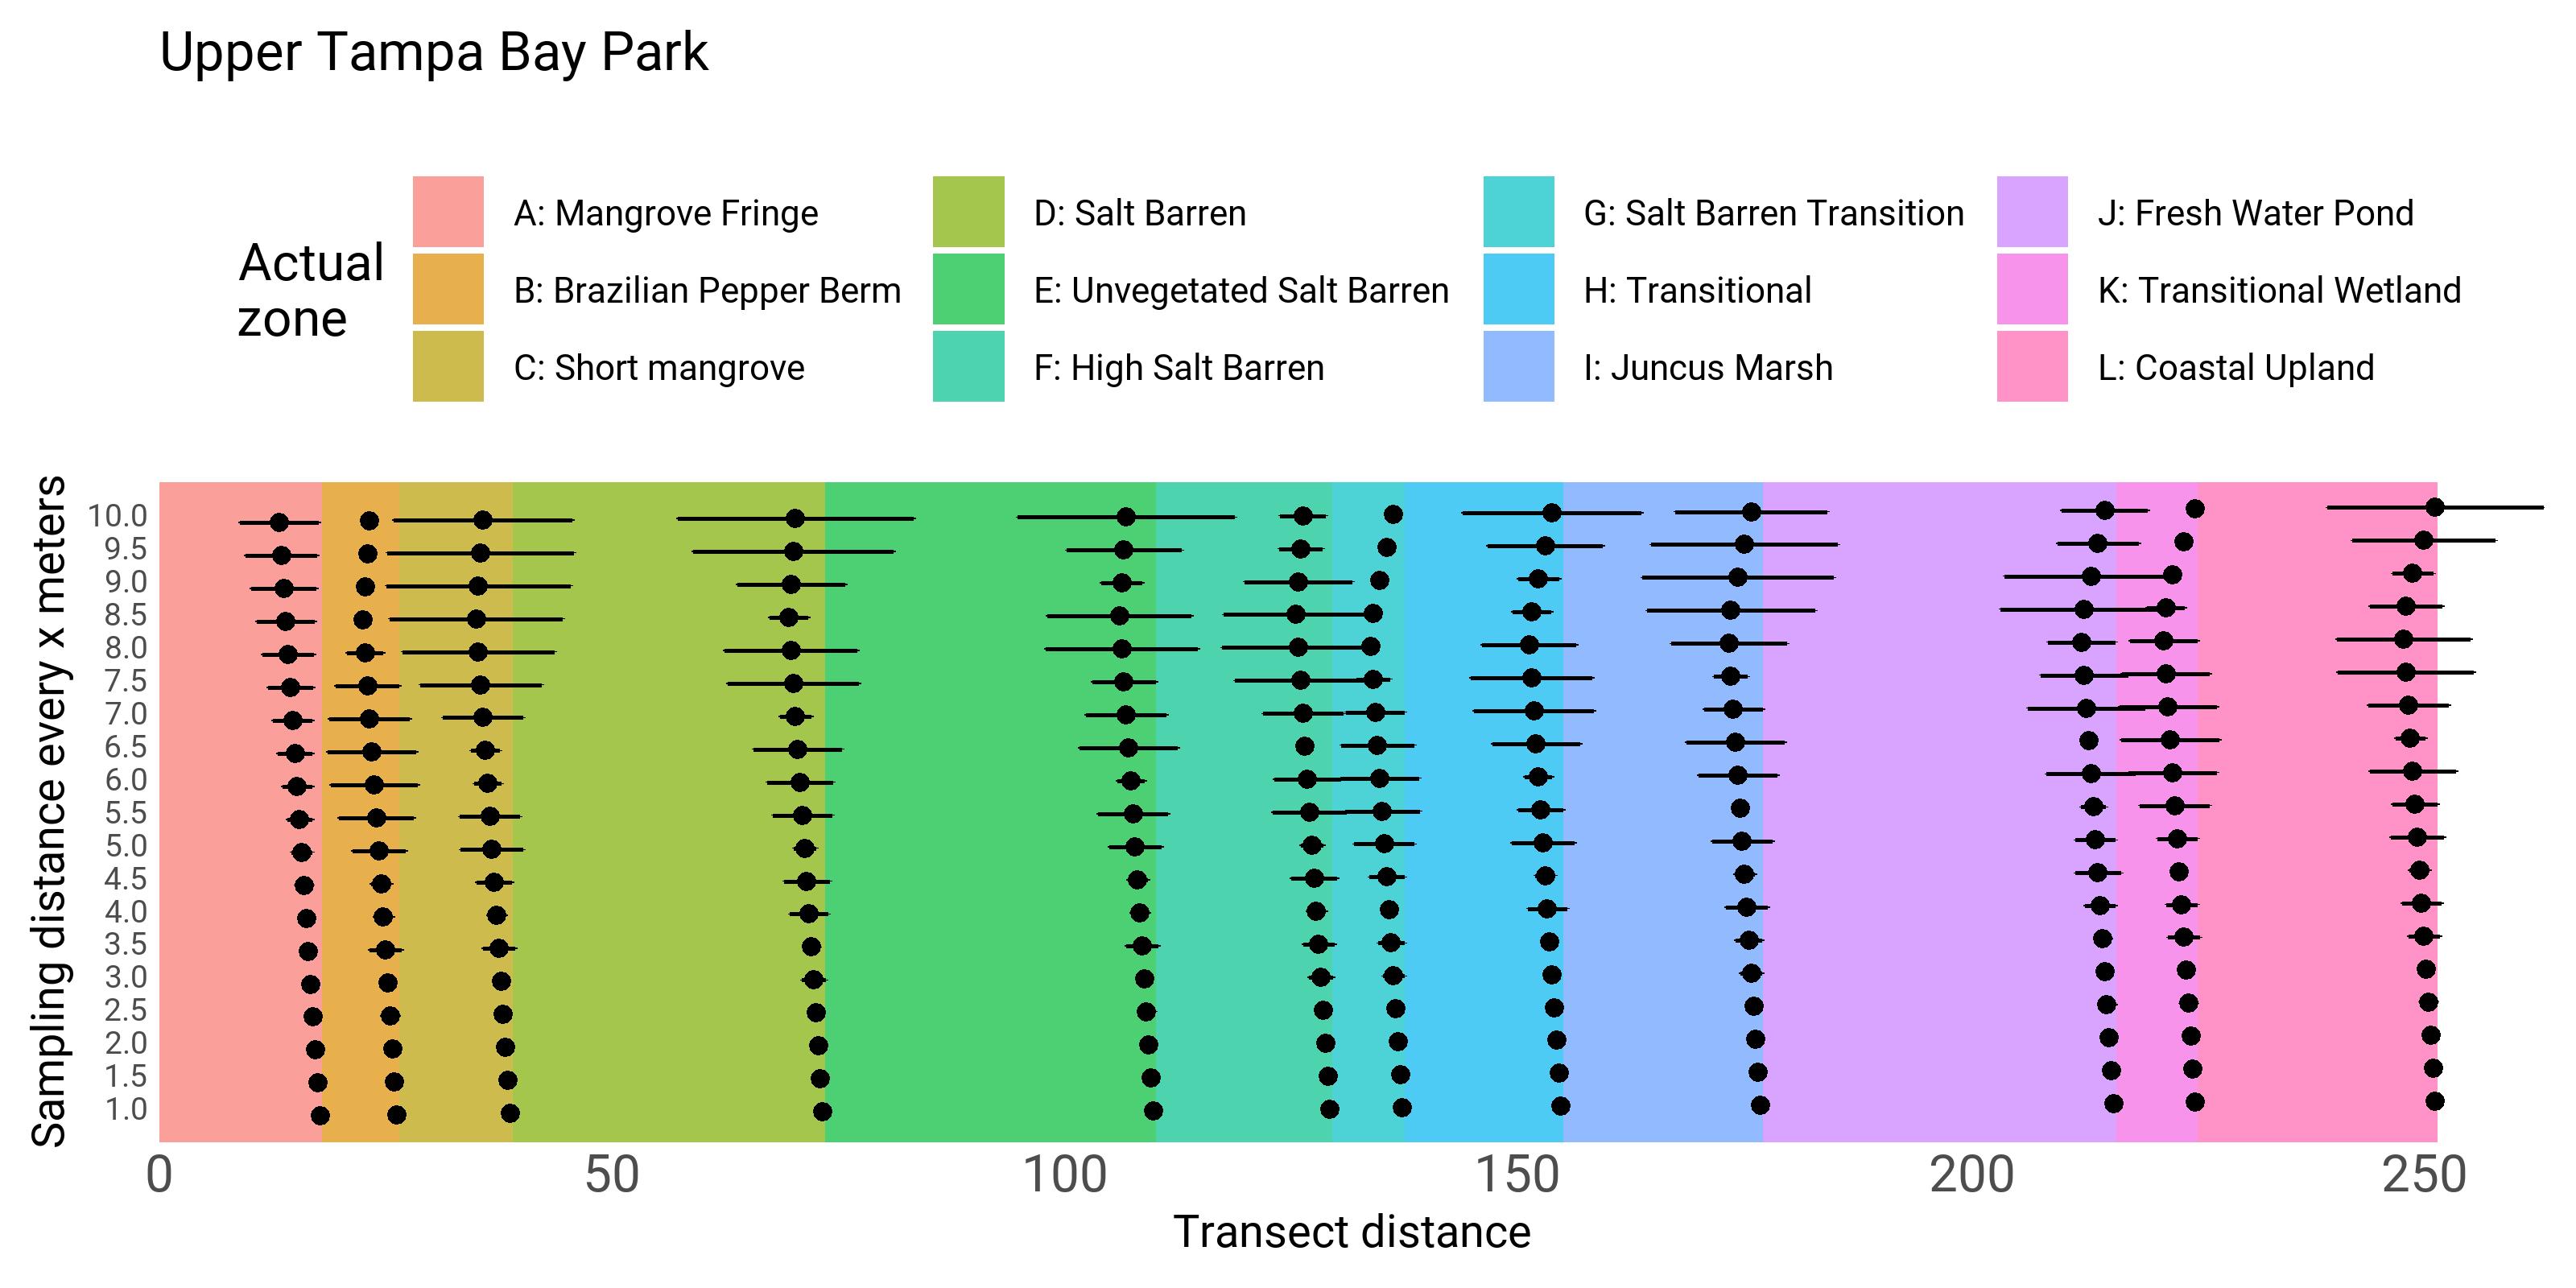
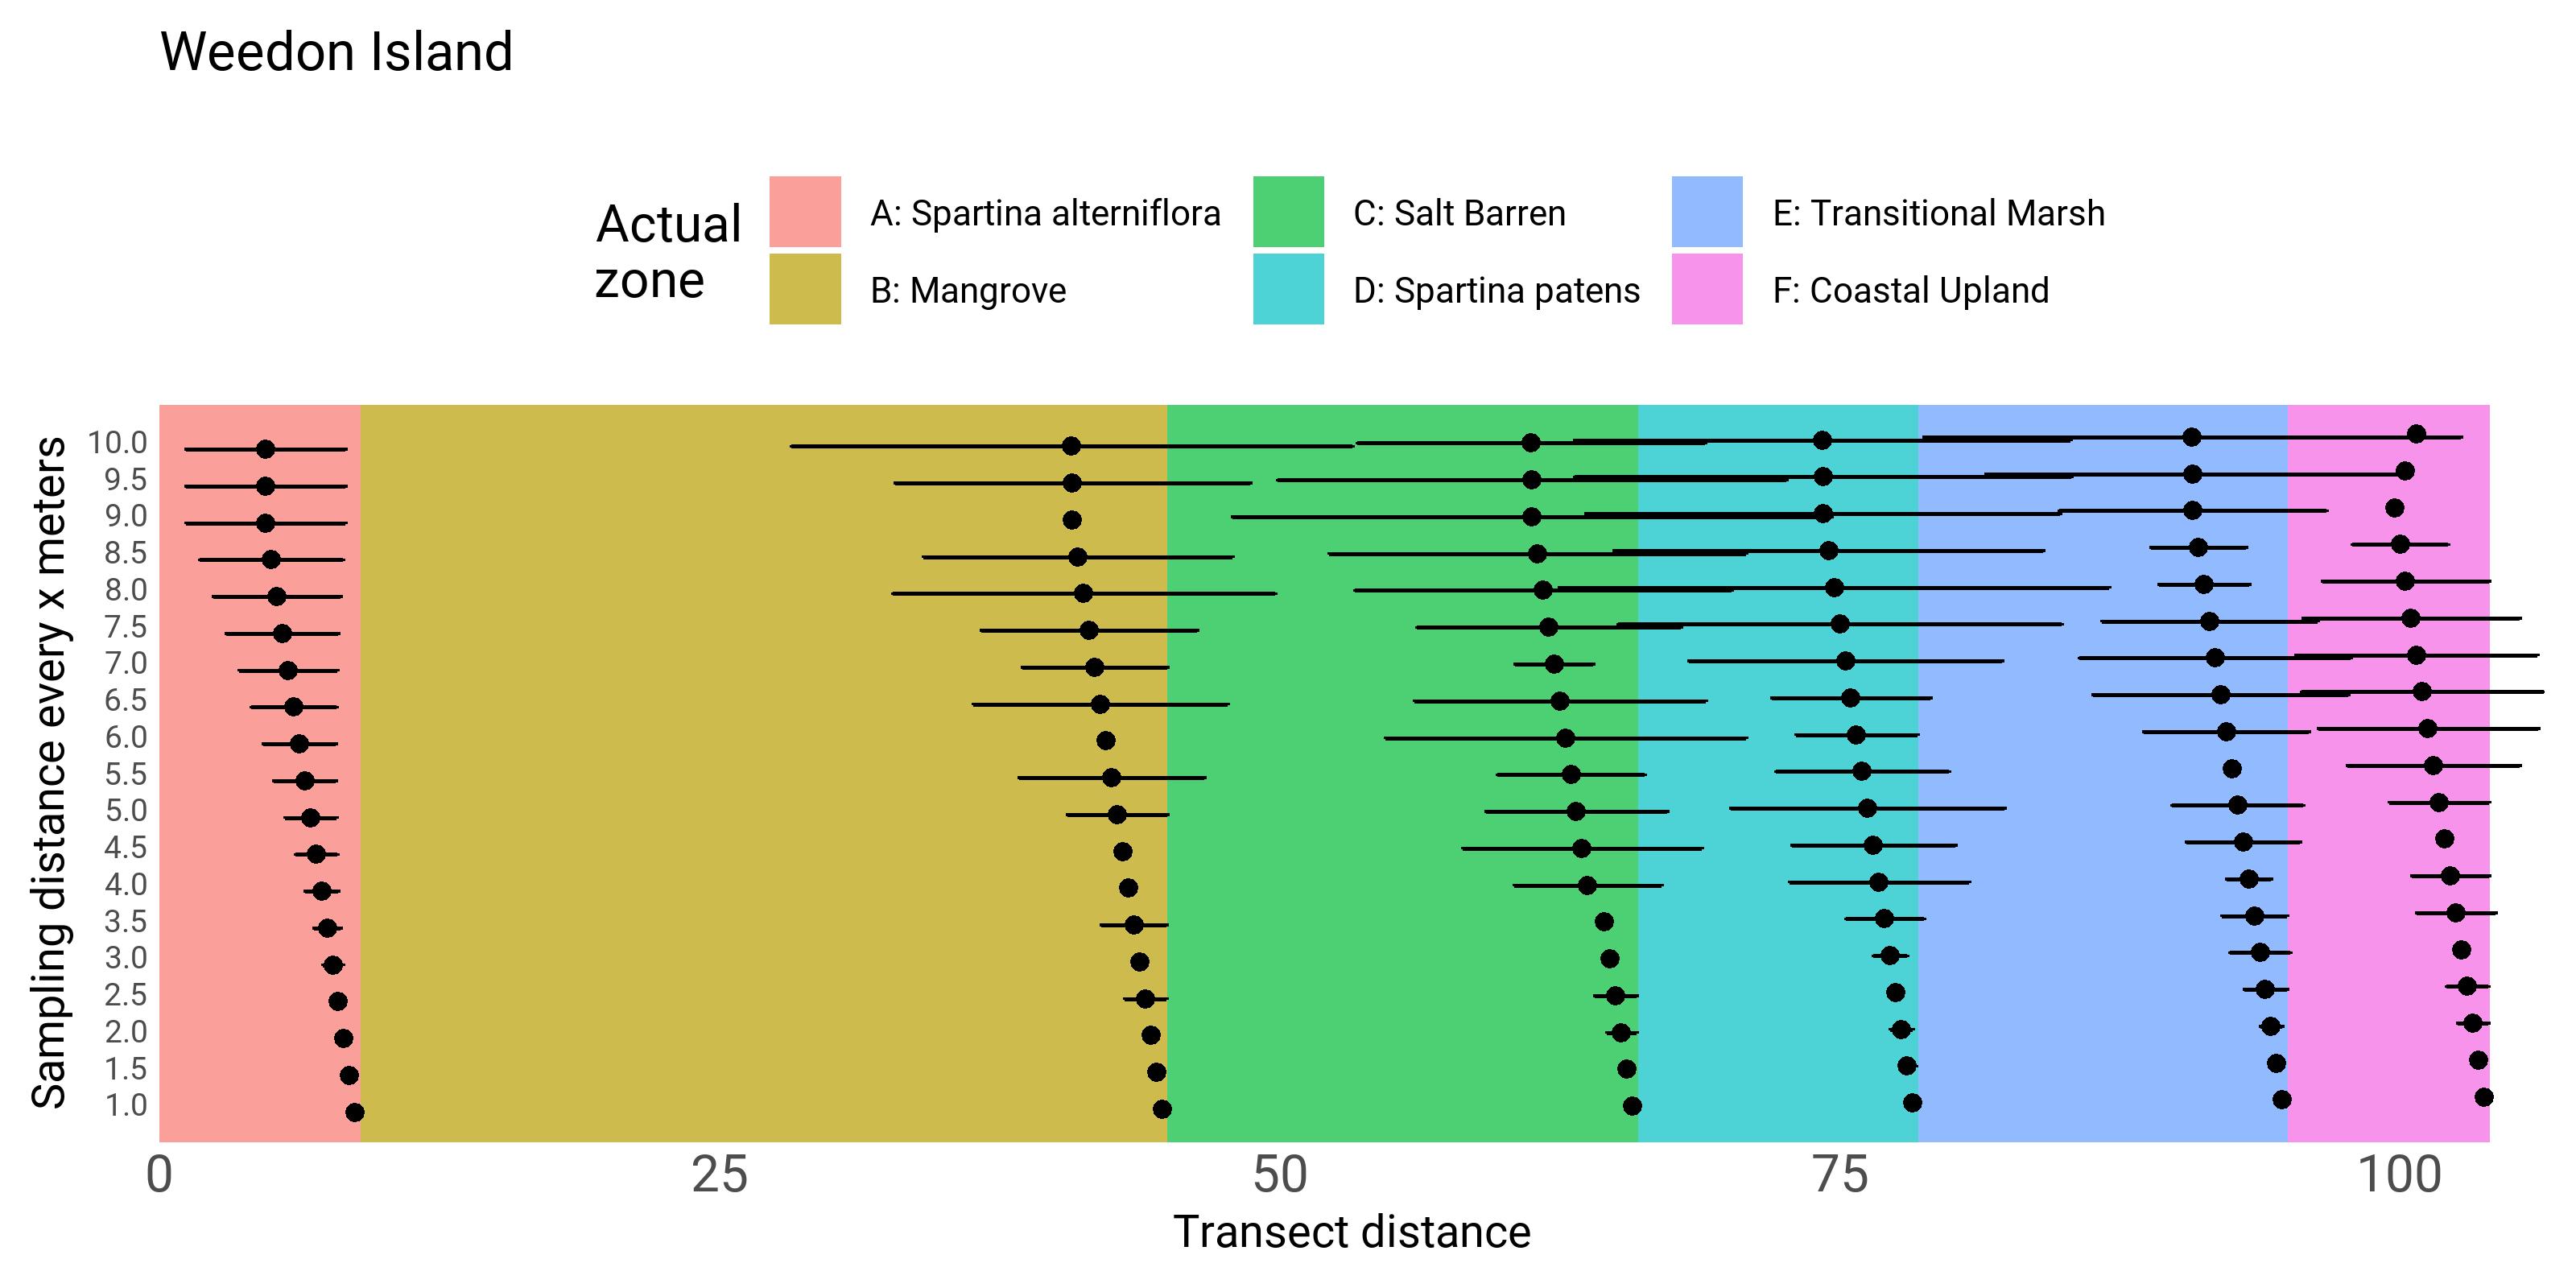
Detailed results for each site are shown below. The shaded areas represent the true zones and the points show the estimates of the starting location for each zone at the specified sampling interval. The horizontal bars show the variance across the sub-samples for each level of sampling effort.