Frequency occurrence
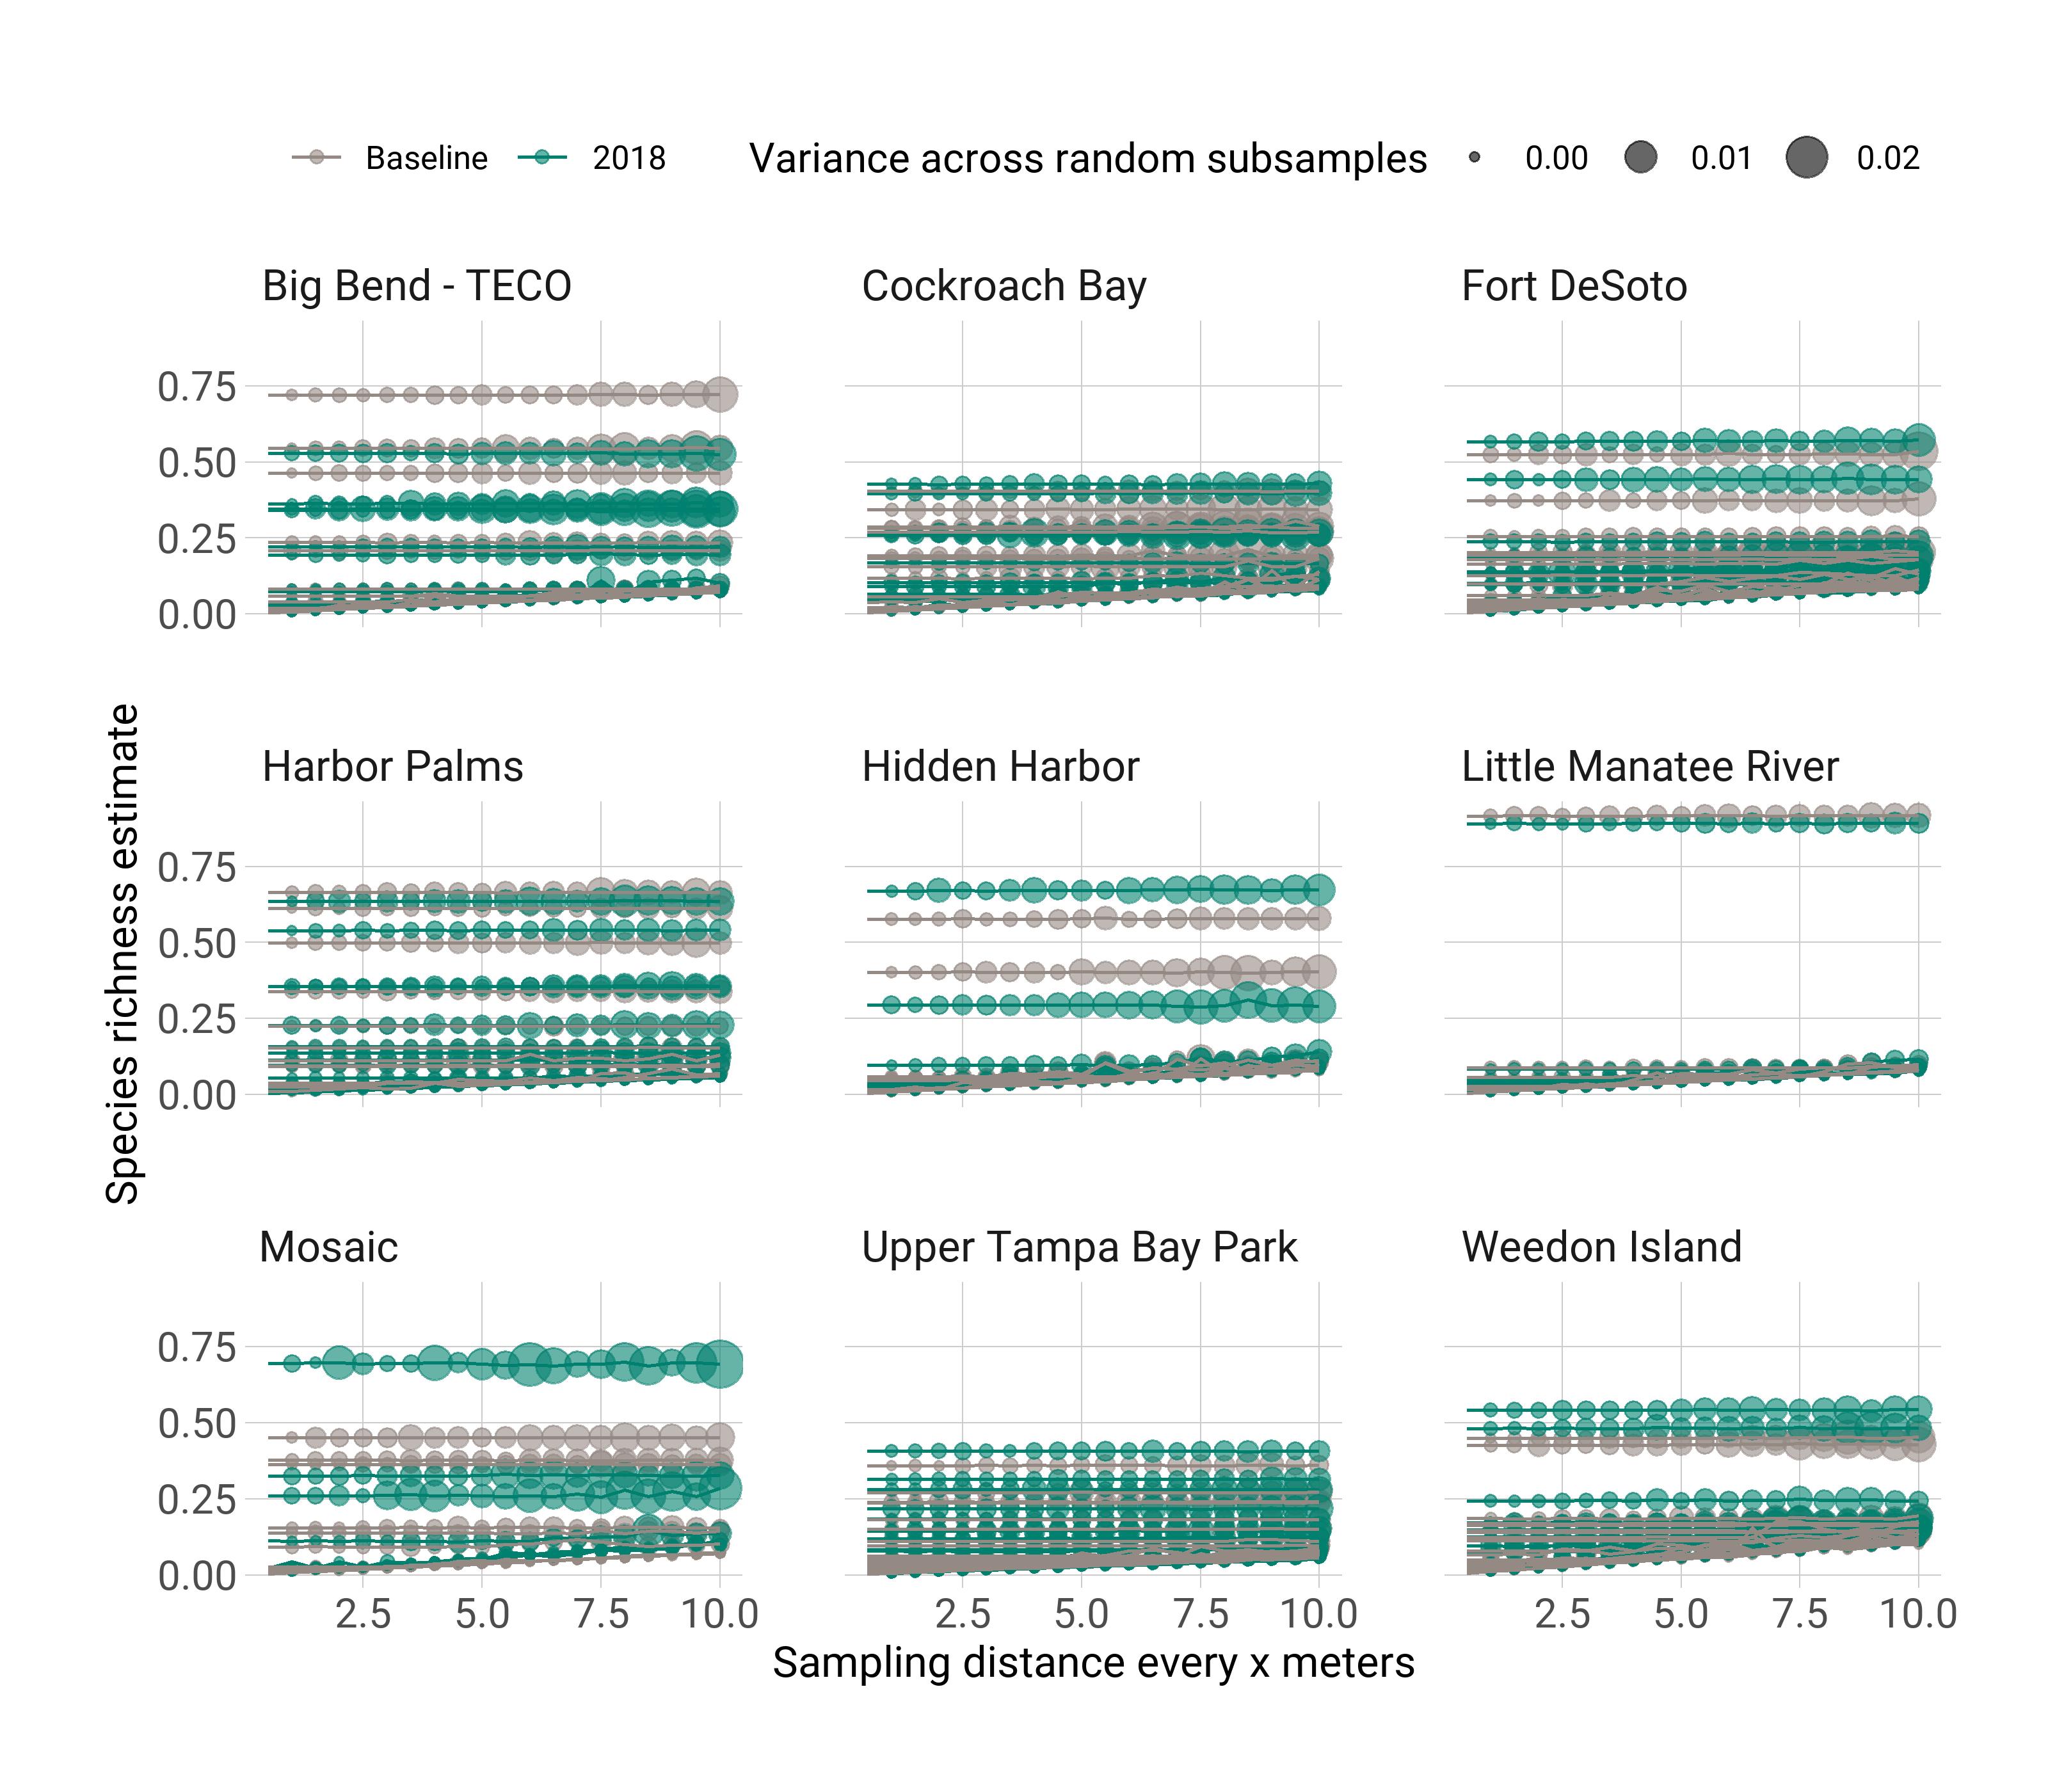
The plot below shows the estimated change in frequency occurrence with reduced sample effort at each site and sample year. Each line shows a different species (labels are not included to reduce plot clutter). The points are sized in proportion to the variance across the random subsamples at the specified level of effort.
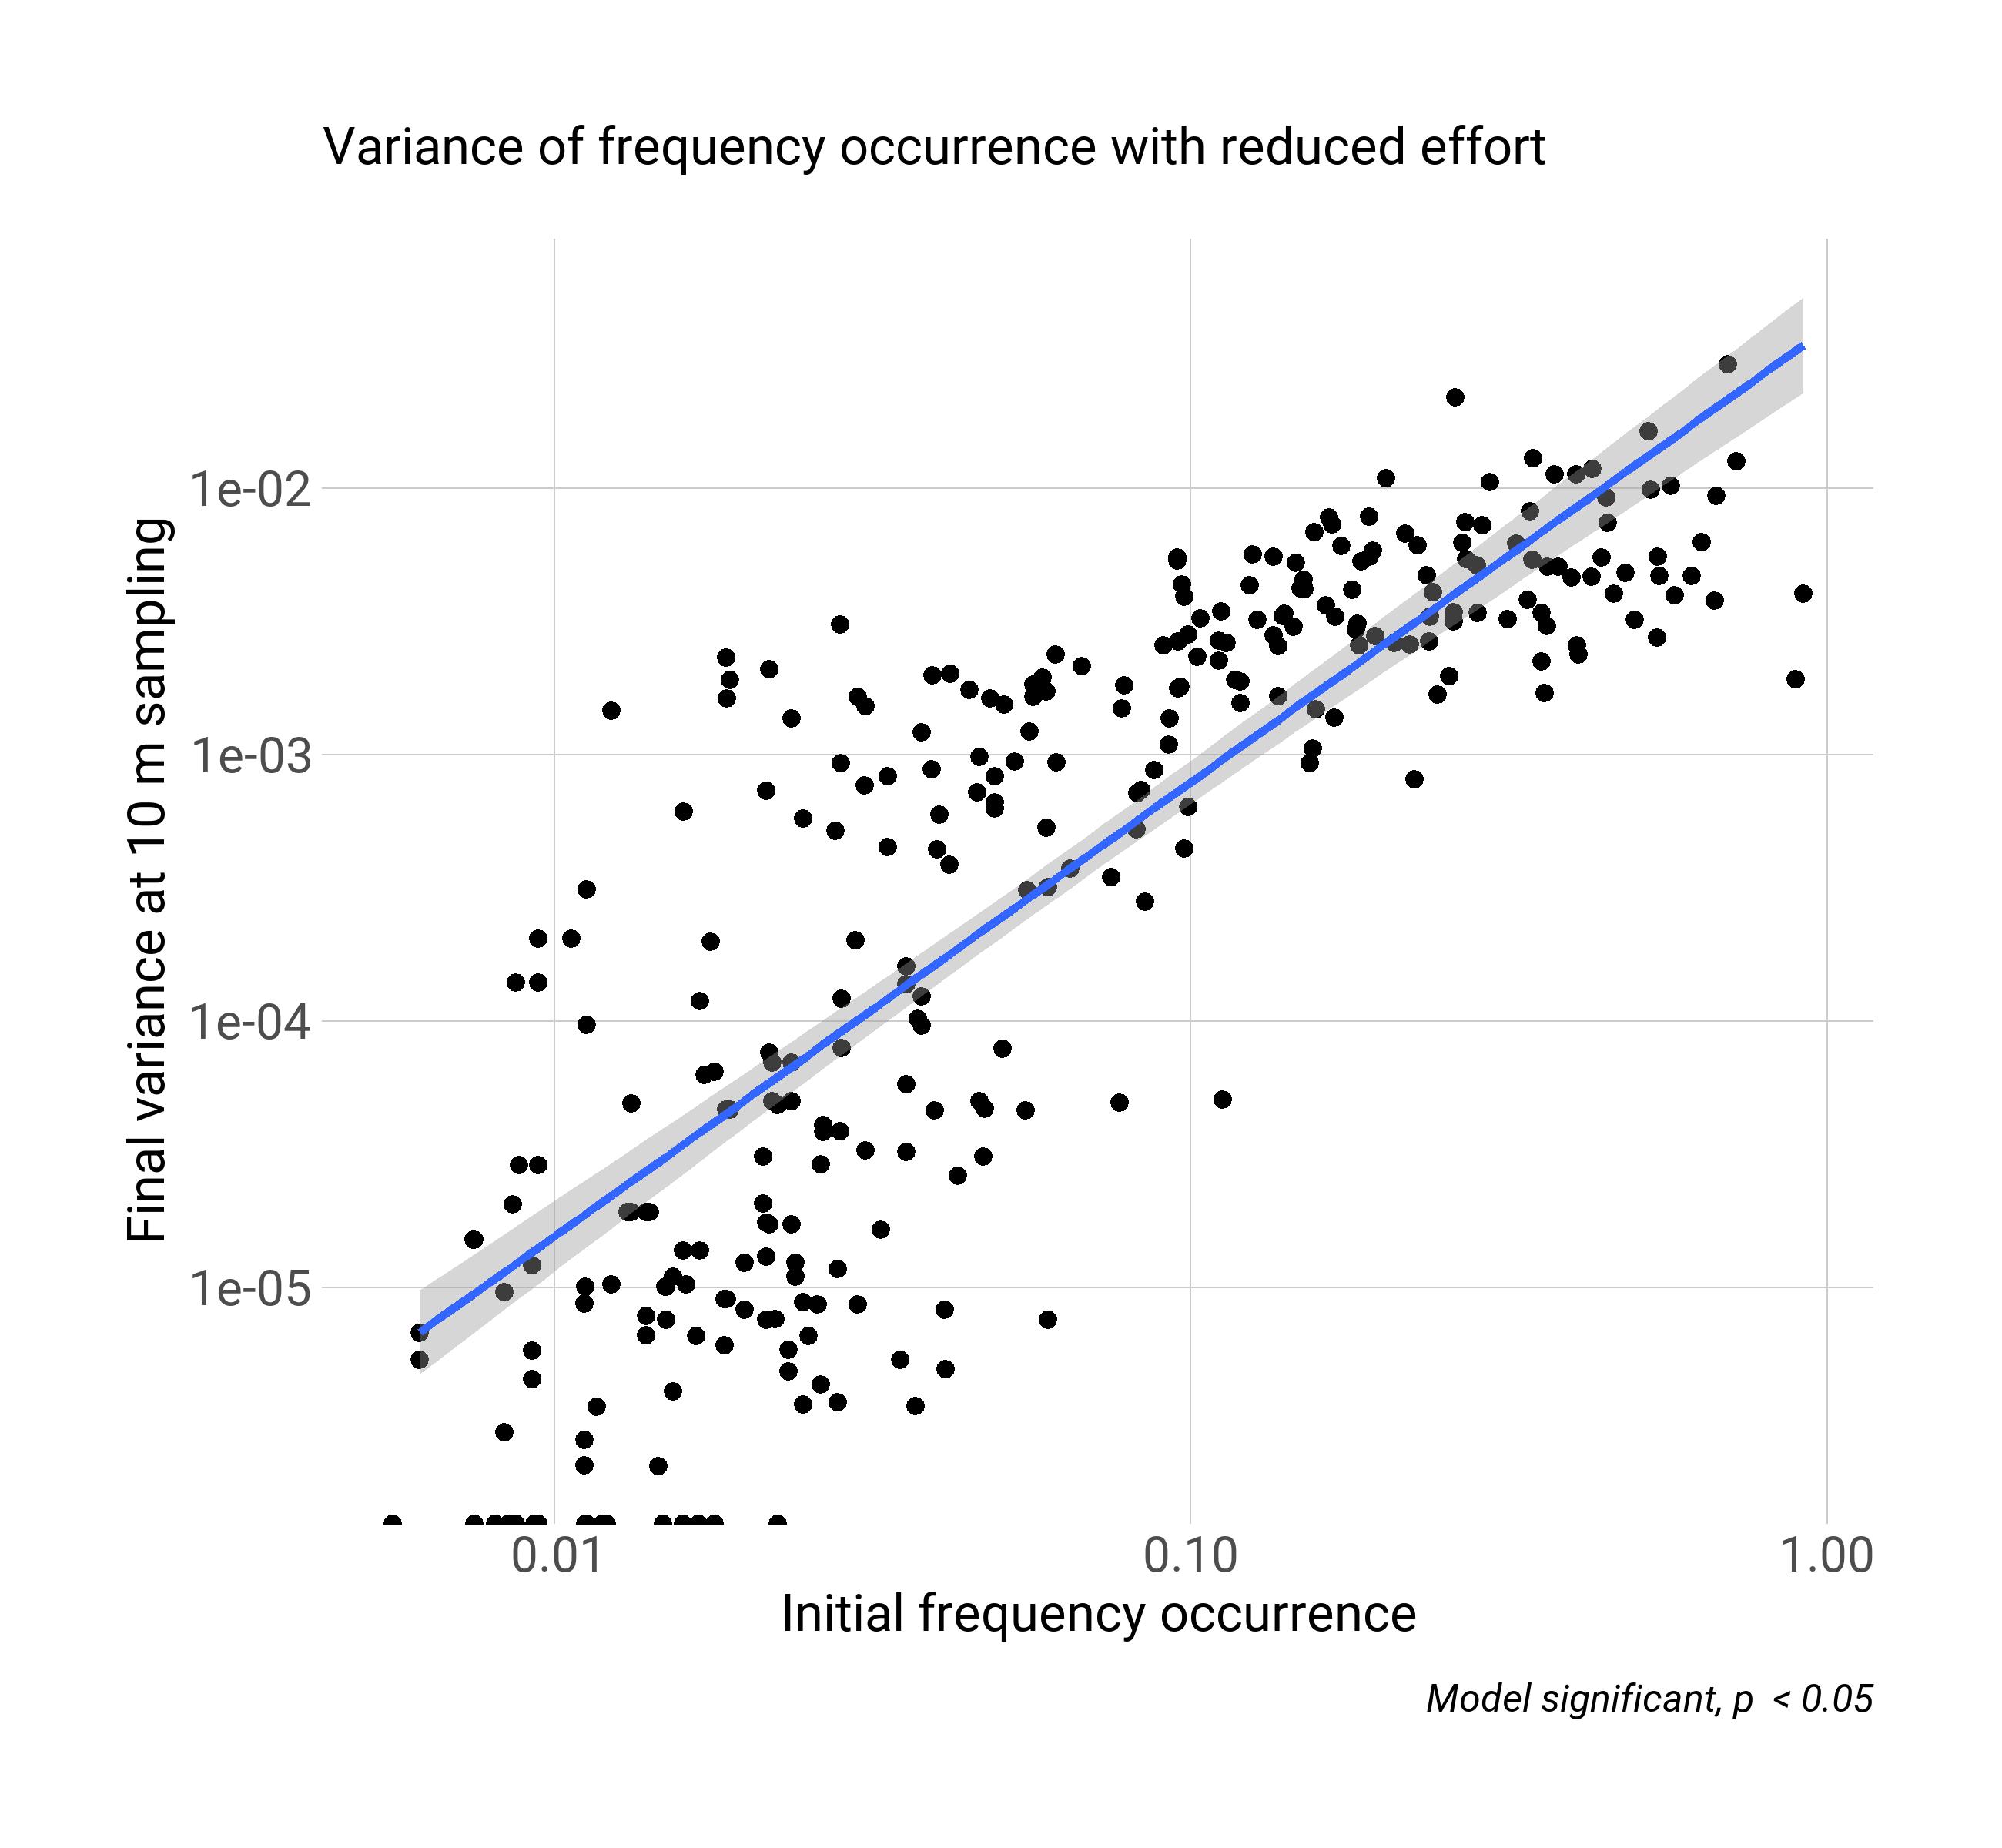
Variance of frequency occurrence with each random subsample shows an increase with a reduction in sample effort. The increase in the variance of frequency occurrence depends on the actual frequency occurrence estimate with complete sample effort. The model below shows that species with higher frequency occurrence will have greater variation in the estimate with reductions in sample effort. The x-axis shows the initial frequency occurrence and the y-axis shows the final variance at 10 m sampling.