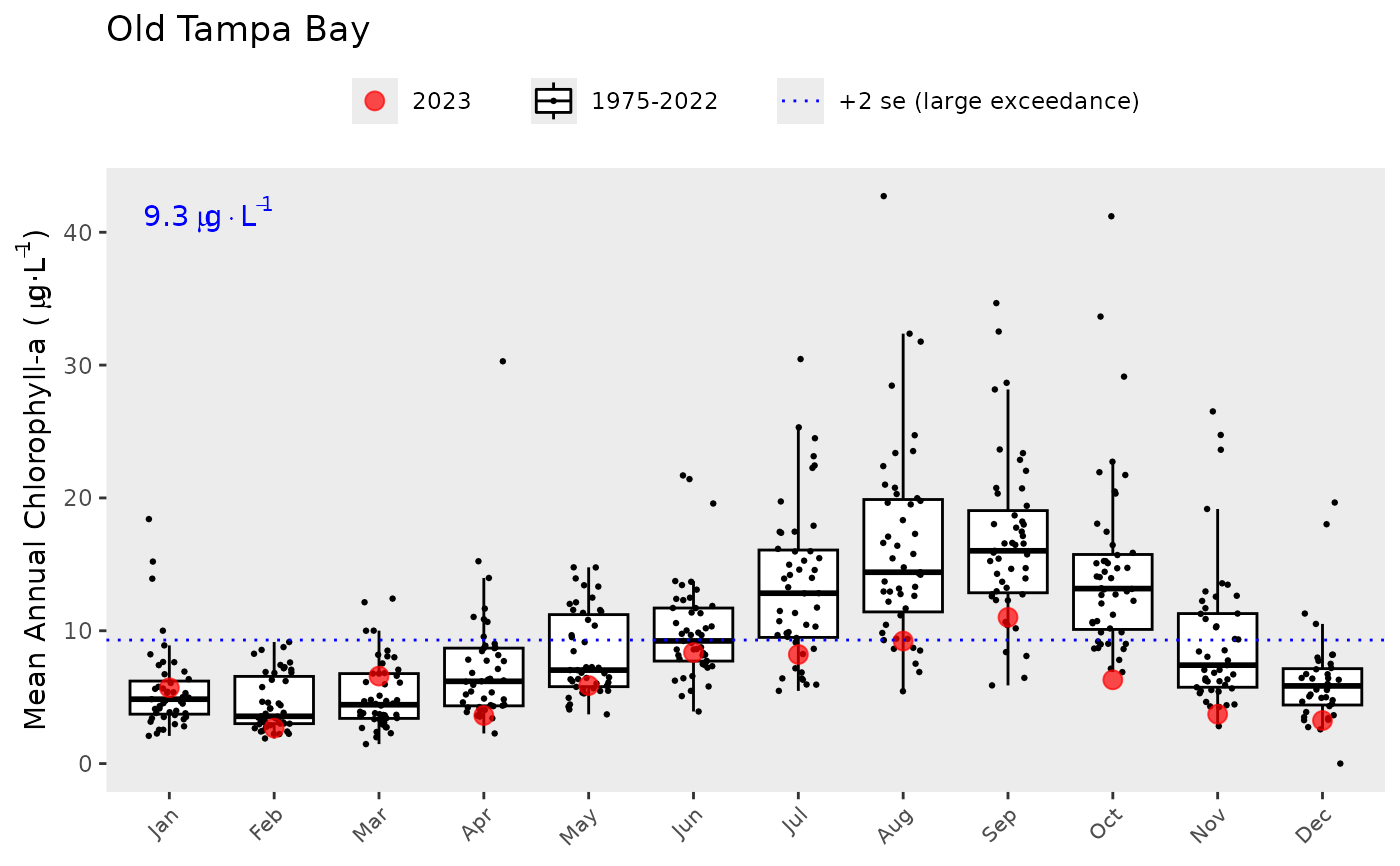
Plot monthly chlorophyll or light attenuation values for a segment
Source:R/show_boxplot.R
show_boxplot.RdPlot monthly chlorophyll or light attenuation values for a bay segment
Arguments
- epcdata
data frame of epc data returned by
read_importwq- param
chr string for which parameter to plot, one of
"chla"for chlorophyll or"la"for light attenuation- yrsel
numeric for year to emphasize, shown as separate red points on the plot
- yrrng
numeric vector indicating min, max years to include
- ptsz
numeric indicating point size of observations not in
yrsel- bay_segment
chr string for the bay segment, one of "OTB", "HB", "MTB", "LTB"
- trgs
optional
data.framefor annual bay segment water quality targets, defaults totargets- family
optional chr string indicating font family for text labels
- labelexp
logical indicating if y axis and target labels are plotted as expressions, default
TRUE- txtlab
logical indicating if a text label for the target value is shown in the plot
- partialyr
logical indicating if incomplete annual data for the most recent year are approximated by five year monthly averages for each parameter
- points
logical indicating if jittered point observations, including outliers, are shown in the plot
Value
A ggplot object
Details
Points not included in yrsel are plotted over the box plots using position_jitter. Use ptsz = -1 to suppress. The dotted line in the plot shows the large exceedance value.