Background
Dashboard: https://shiny.tbep.org/tidalcreek-dash/
Tidal creeks (aka tributaries) are essential habitats in the Tampa Bay Estuary and serve as important focal points for understanding watershed inputs that affect water quality. A fundamental goal of the Tampa Bay Estuary Program is to develop effective nutrient management strategies to support the ecological function of tidal creeks. In partnership with Sarasota Bay NEP, Coastal & Heartland NEP, and local government and agency stakeholders, an open science framework has been developed for assessing the tidal creek condition based on a host of commonly collected water quality data [1–3]. These assessments can support tracking of water quality management goals and can help refine restoration and management plans in priority tributaries, including those in need of hydrologic restoration that can support critical nursery habitats for sportfishes.
The tbeptools package includes a simple
features spatial data object of the population of tidal creeks in
southwest Florida, called tidalcreeks(). This includes 623
polyline features designated by a water body ID (WBID),
creek id (JEI), and FDEP
class (class, 1 for potable water, 2 for shellfish
harvesting or propagation, and 3F/3M for freshwater/marine fish
consumption, recreation, propagation and maintenance of a healthy,
well-balanced population of fish and wildlife).
mapview(tidalcreeks, homebutton = F, legend = F)The tidal creek assessment framework was established based on data
from the FDEP Impaired
Waters Rule database run 56 available here which
includes data collected through January 10th 2019. However, this
framework is used for future IWR databases to refresh the site with new
data as it becomes available. Raw and updated data from the IWR database
required for assessment is provided in the tbeptools package in the
iwrraw() data object.
Assessment
The tidal creek assessment framework includes both a “report card” and “indicators” assessment which are provided as separate tabs in the dashboard. The report card provides an assessment of total nitrogen concentrations (the limiting nutrient in these creeks) based on annual geometric average concentrations relative to standards developed for contributing freshwater streams. The indicators are based a several water quality metrics derived as outcomes of our study to describe tidal creek condition and provide insights into site specific attributes of these creeks that may govern overall creek health.
Report card
The report card is similar to the TBEP water quality report card in that tidal creeks are assigned to categories within an assessment framework intended to serve as both a mechanism for evaluating data relative to the need for management action, and to identify stewardship goals that, if properly pursued, may preclude the need for any regulatory actions. These categories were established based principally on fish as a biological response indicator. Tidal creeks are assigned to one of five categories:
No Data: Data are unavailable for evaluation.
Monitor: Creek is at or below nitrogen concentrations that protect individual creek types within the larger population of creeks.
Caution: Creek nutrients showing signs of elevated nutrient concentrations that may increase risk of eutrophic condition.
Investigate: Creek nutrient concentrations above margin of safety to protect creek from potential impairment.
Prioritize: Creek nutrient concentrations have exceeded regulatory standard for associated freshwater portion of tributary indicating that actions are needed to identify remediative measures to reduce nutrients to the creek.
Conceptually, these thresholds appear in the figure below.
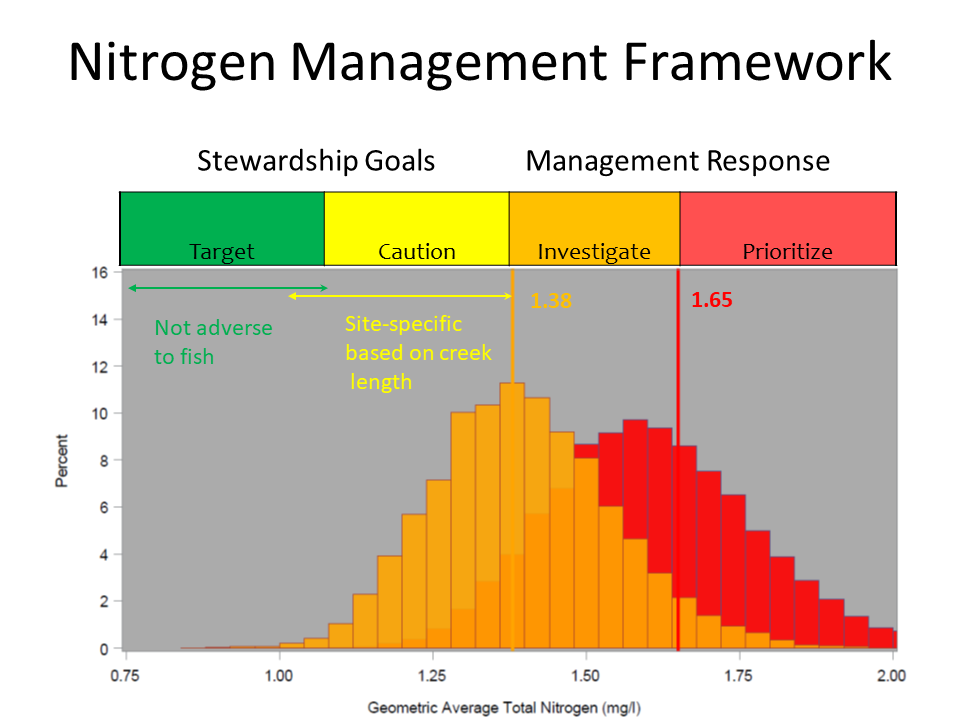
Scoring rubrik for tidal creeks based on nitrogen thresholds.
The Prioritize category was defined based on Florida’s freshwater stream numeric nutrient criteria (NNC).Two different freshwater stream NNC are applicable to our region; the West Central NNC of 1.65 mg/l and Peninsular region NNC of 1.54 mg/l. The histograms in the above figure represent a range of annual geometric mean (AGM) nitrogen concentrations associated with the Prioritize and Investigate categories which are based on the NNC. In the example above, the maximum expected distribution of AGMs not to exceed of 1.65 mg/l with a 1:3 exceedence probability (as defined in F.A.C. 62-303) was generated using monte carlo simulation and the highest observed standard deviation from data collected during the first creeks study. The Investigate category was then defined as an explicit margin of safety by adjusting the distribution to find the grand geometric average that would result in a 1:20 chance of exceeding 1.65 mg/l. Assignment of a creek into the Caution category depended on a creek length adjustment as described below to protect smaller creeks from elevated nutrient concentrations.
The tidaltargets() data object included in tbeptools
includes these thresholds. Note that the “Caution” category is a
function of creek length.
tidaltargets
#>         region prioritize investigate
#> 1 West Central       1.65        1.38
#> 2    Peninsula       1.54        1.30
#>                                             caution
#> 1 1.38 - 0.0174 * (23.78 - (Creek_Length_m / 1000))
#> 2 1.30 - 0.0174 * (23.78 - (Creek_Length_m / 1000))
A scoring algorithm was derived to define the final report card outcome for each creek using the entire ten year record of available data based on the following criteria. A single exceedance of the Prioritize and Investigate categories in any year of the ten year record would result in a classification of that creek into the respective category unless at least three other years of data were below the threshold level for that category. Creeks were assigned the next lower category if only one AGM for TN was above a given level while multiple other years (i.e., more than two) were below the given levels defining the cutoff points for each category. For example, a creek with at least 4 years of data and only a single exceedance of the Prioritize threshold would be assigned the Investigate category. Outcomes are exemplified below.
Report card functions
The two primary functions for the tidal creek assessments are
anlz_tdlcrk() to obtain the scores and
show_tdlcrk() to view an interactive map of the results.
The anlz_tdlcrk() function uses the included
tidalcreeks() and iwrraw() datasets to
estimate the scores:
results <- anlz_tdlcrk(tidalcreeks, iwrraw)
results
#> # A tibble: 623 × 10
#>       id wbid  JEI   name     class monitor caution investigate prioritize score
#>    <int> <chr> <chr> <chr>    <chr>   <dbl>   <dbl>       <dbl>      <dbl> <chr>
#>  1     1 1983B CC01  Rock Cr… 2           1      NA          NA         NA Moni…
#>  2     2 2052  CC01  Rock Cr… 3M         10      NA          NA         NA Moni…
#>  3     3 1983B CC02  Oyster … 2          NA      NA          NA         NA No D…
#>  4     4 2067  CC02  Oyster … 3M         10      NA          NA         NA Moni…
#>  5     5 1983B CC03  Buck Cr… 2          NA      NA          NA         NA No D…
#>  6     6 2068A CC03  Buck Cr… 3M          9       1          NA         NA Moni…
#>  7     7 2078A CC04  Buck Cr… 2          NA      NA           1         NA Inve…
#>  8     8 2078A CC05  Coral C… 2          NA      NA          NA         NA No D…
#>  9     9 2078B CC05  Coral C… 2           7      NA          NA         NA Moni…
#> 10    10 2065C CC06  Catfish… 2           3      NA          NA         NA Moni…
#> # ℹ 613 more rows
The results include a unique creek identifier (id, based
on the wbid and JEI fields), the waterbody id
(wbid), the creek ID (JEI), the FDEP class
(class), and results from the assessment in the remaining
columns. The columns monitor, caution,
investigate, and prioritize indicate the
number of years from 2012 to 2021 that the nitrogen values were within
the ranges appropriate for the creek type as specified within
tidaltargets(). The score column indicates the
overall category assigned to the creek for the period of record. Note
that many creeks are assigned a No Data value if sufficient
data were unavailable. A summation of the four component columns
(monitor, caution, investigate,
and prioritize) provides the number of years for which data
were available at a creek.
The show_tdlcrk() function can be used with the output
of anlz_tdlcrk() to view an interactive map of the results.
Creeks are color-coded by the exceedance categories, with “No Data”
creeks shown in light blue.
show_tdlcrk(results)A report card style matrix can be plotted using the
show_tdlcrkmatrix() function that shows the overall creek
score and the number of years of data that were used to estimate the
overall score. The plot shows a matrix with rows for individual creeks
and columns for overall creek score. The columns show an overall creek
score and the number of years in the prior ten years that nitrogen
values at a creek were assigned to each of the four score categories.
Number of years is mapped to cell transparency. By default, the plot
shows creeks with a marine WBID (water body identifier) designation as
3M or 2. This can be changed with the
class argument (i.e.,
class c('3M', '2', '3F', '1') for marine and freshwater
WBIDs).
show_tdlcrkmatrix(results)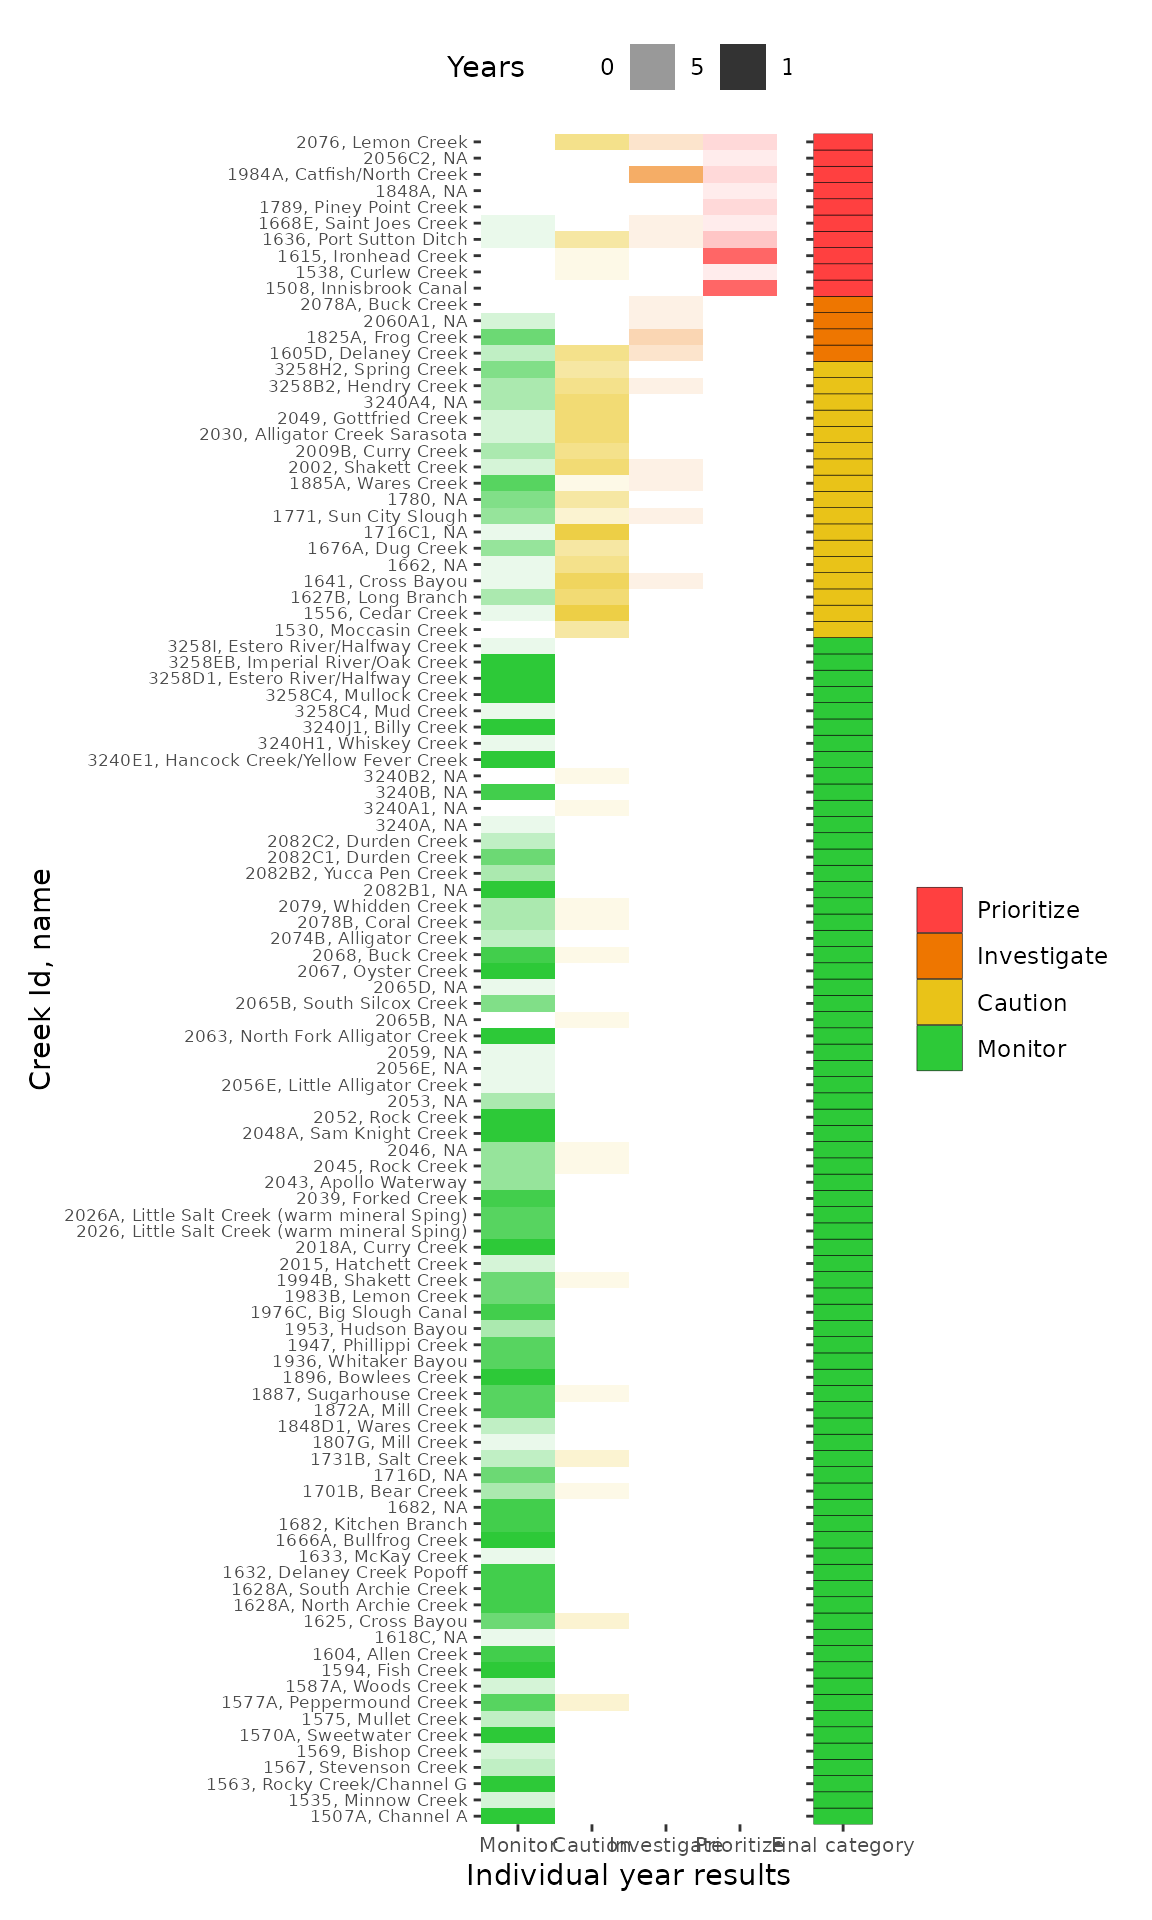
Indicator functions
Water quality Indicators were developed to provide context for interpreting the report card outcomes as described in detail in Wessel et al. 2021 and include thresholds for total nitrogen (>1.1 mg/l), chlorophyll a (>11 ug/l), dissolved oxygen (< 42 % saturation), a trophic state index score (>55), the chlorophyll/nitrogen ratio (>15) and a ratio of the nitrates in the tidal and freshwater portion of the creek (>1) (if data are available). The results for each indicator relative to the established thresholds are calculated on an annual basis and then synthesized for the 10 year period by calculating the percentage of annual outcomes exceeding the identified threshold indicator values out of the total number of years with available data. An integrative summary for all indicators is presented using a standardized polar coordinate system and Radar Charts to provide a single multi-metric summary plot of the results across indicators.
The anlz_tdlcrkindic() function generates these annual
outcomes for each wbid/JEI combination.
results <- anlz_tdlcrkindic(tidalcreeks, iwrraw)
head(results)
#>   id       name  JEI  wbid class year    CHLAC     COLOR     COND       DO
#> 1  1 Rock Creek CC01 1983B     2 2022       NA        NA 53297.25 4.159892
#> 2  2 Rock Creek CC01  2052    3M 2016 2.265462 19.130797       NA 3.980251
#> 3  2 Rock Creek CC01  2052    3M 2017 2.851726 15.395763       NA 4.157777
#> 4  2 Rock Creek CC01  2052    3M 2018 1.934899 11.655004       NA 4.219790
#> 5  2 Rock Creek CC01  2052    3M 2019 2.071003  7.214250       NA 3.015847
#> 6  2 Rock Creek CC01  2052    3M 2020 1.283014  6.401676       NA 5.858378
#>      DOSAT        NO23 ORGN    SALIN       TKN        TN         TP  TSS
#> 1 66.54848 0.006000000   NA 35.18500 0.6260000 0.6260000 0.06500000 45.3
#> 2 55.96637 0.008532522   NA 25.84531 0.5813818 0.5408161 0.08330509   NA
#> 3 60.18017 0.007447260   NA 24.86909 0.6255197 0.6326848 0.07566682   NA
#> 4 63.32630 0.006994714   NA 31.32419 0.5668727 0.5734574 0.07432007   NA
#> 5 44.90322 0.007047106   NA 31.63214 0.5053022 0.4577485 0.06300538   NA
#> 6 74.97221 0.009582840   NA 34.00753 0.4665677 0.3610097 0.06714974   NA
#>       TURB chla_tn_ratio tn_tp_ratio chla_tsi   tn_tsi  tn2_tsi   tp_tsi
#> 1 2.300000            NA    9.630769       NA 46.72558 49.53273 59.24360
#> 2 2.082253      4.188970    6.491994 28.57601 43.82942 46.38844 63.85868
#> 3 1.802161      4.507341    8.361456 31.89011 46.93590 49.76107 62.06992
#> 4 2.454007      3.374095    7.716050 26.30480 44.98978 47.64821 61.73589
#> 5 1.831953      4.524324    7.265229 27.28367 40.52758 42.80384 58.66389
#> 6 2.185581      3.553960    5.376189 20.38865 35.82676 37.70067 59.84880
#>    tp2_tsi  nut_tsi      tsi no23_source no23_tidal no23_ratio do_bnml do_prop
#> 1 74.71554 49.53273       NA          NA         NA         NA       0       0
#> 2 80.57123 46.38844 37.48223          NA         NA         NA       0       1
#> 3 78.30162 49.76107 40.82559          NA         NA         NA       0       0
#> 4 77.87779 47.64821 36.97650          NA         NA         NA       0       1
#> 5 73.97999 42.80384 35.04375          NA         NA         NA       1       1
#> 6 75.48343 37.70067 29.04466          NA         NA         NA       0       0
Individual creek indicators are summarized using a multivariate
response plot called a “radar plot” that indicates the percentage of
years where each indicator exceeded its respective threshold value.
These plots are created by using the radar = TRUE argument
with anlz_tdlcrkindic() function and then using those
results with the show_tdlcrkradar() function. The radar
plots only apply to the marine WBIDs of the tidal creeks (Florida DEP
class 2, 3M). Indicators without data for the creek do not have a point
on the plot.
cntdat <- anlz_tdlcrkindic(tidalcreeks, iwrraw, yr = 2025, radar = T)

# get random creek id
set.seed(123)
id <- sample(unique(cntdat$id), 1)
show_tdlcrkradar(id = id, cntdat = cntdat)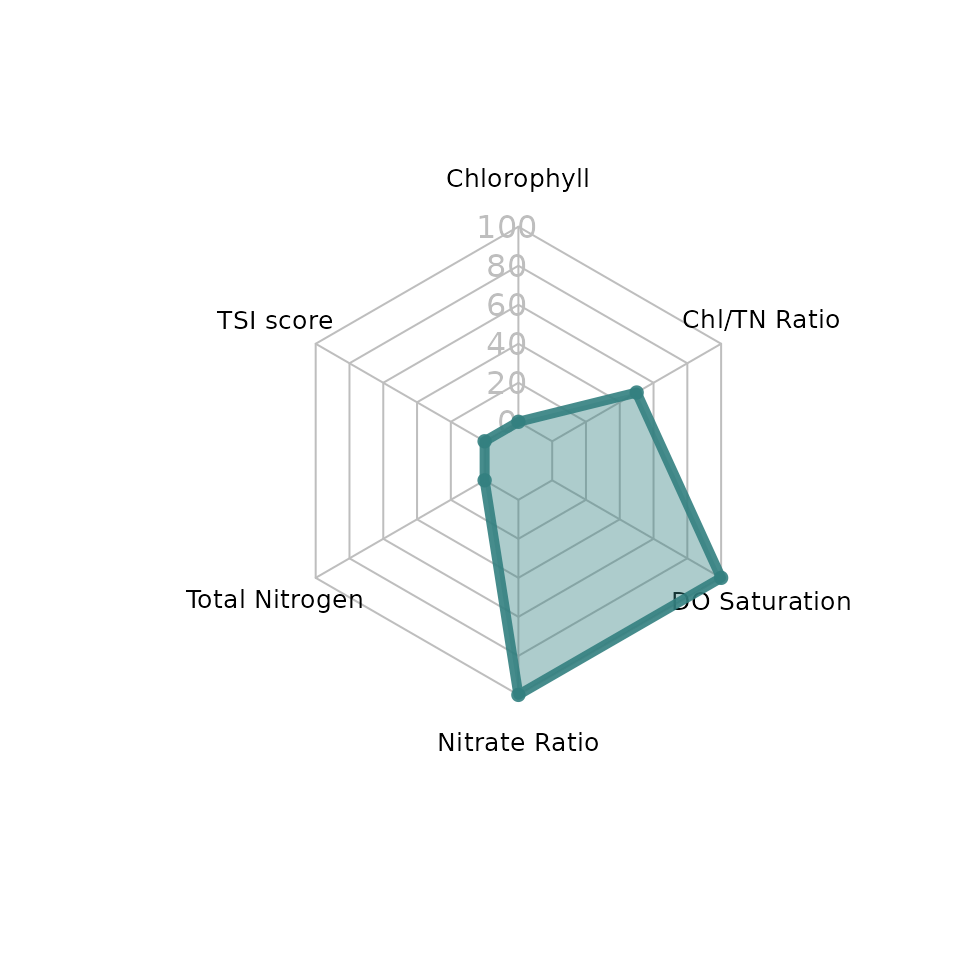
General descriptive plots of the annual outcomes are provided with
interactive plotly graphics using the
show_tdlcrkindic() and show_tdlcrkindiccdf()
functions.
The show_tdlcrindic() function produces bar plots of
annual outcomes at the selected creek. The creek to plot is selected
with the id argument as an integer that is used to filter
results from the anlz_tdlcrkindic() function, where the
latter is passed to the cntdat argument. The
thrsel argument plots dotted red lines based on the
threshold values. Each year has its own unique color.
cntdat <- anlz_tdlcrkindic(tidalcreeks, iwrraw, yr = 2025)
show_tdlcrkindic(id = id, cntdat = cntdat, thrsel = TRUE)
The show_tdlcrkindiccdf() function is similar except
that empirical cumulative distribution functions (CDF) are plotted to
evaluate outcomes for a specific creek relative to the entire
distribution of creeks in southwest Florida. Each indicator and each
year for the selected creek are plotted on the CDF curves. Location of
the points indicate both a comparison to the population and the
trajectory of indicators over time (i.e., brown are older observations
and blue are more recent). Holding the mouse cursor over a point shows
the year and holding the cursor over the line shows the percentile value
from the CDF.
show_tdlcrkindiccdf(id = id, cntdat = cntdat, thrsel = TRUE)