Plot the tidal creek report card matrix
Arguments
- dat
input creek score data returned from
anlz_tdlcrk- class
character vector indicating which creek classes to show, one to many of
'3M','2','3F', and'1'. Defaults to marine only ('3M', '2').- score
character vector of score categories to include, one to many of
'Prioritize','Investigate','Caution', and'Monitor'. Defaults to all.- family
optional chr string indicating font family for text labels
- size
numeric for text and line scaling
Value
A static ggplot object is returned.
Details
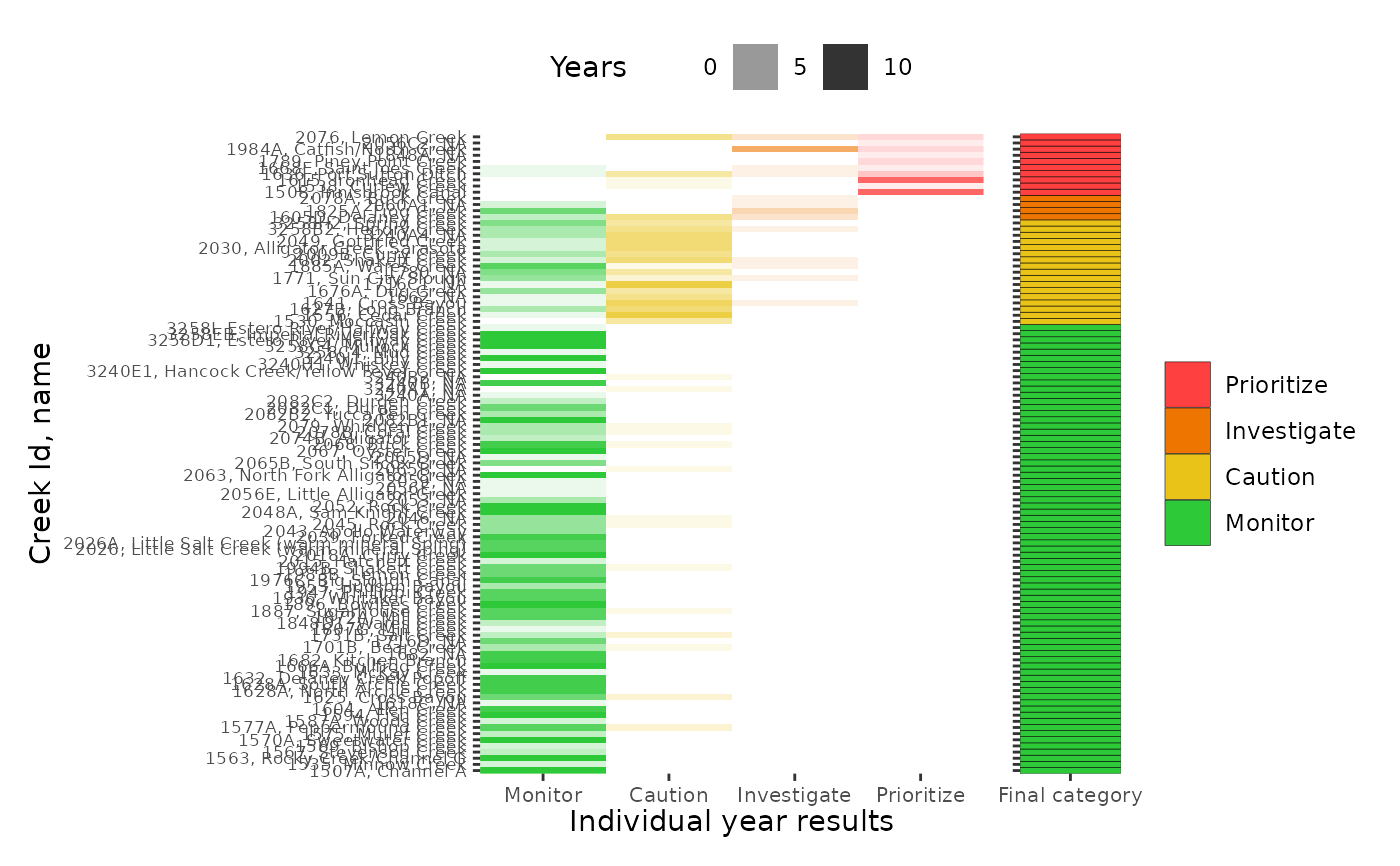
The plot shows a matrix with rows for individual creeks and columns for overall creek score. The columns show an overall creek score and the number of years in the prior ten years that nitrogen values at a creek were assigned to each of the four score categories. Number of years is mapped to cell transparency.
Examples
dat <- anlz_tdlcrk(tidalcreeks, iwrraw, yr = 2025)
show_tdlcrkmatrix(dat)