Background
Fecal Indicator Bacteria (FIB) are used to track concentrations of pathogens in surface waters that may be detrimental to human health and the environment. Exposure risk is commonly measured with select indicators that are present in the human gut and can enter the environment through wastewater discharges, stormwater, or other illicit sources. Common indicators include concentrations of E. coli, Enterococcus, or Fecal Coliform as the number of colony forming units (CFU) per 100 mL of water.
Many monitoring programs routinely measure FIB concentrations at select locations. The tbeptools package has several functions for importing and reporting these data. Three workflows are available:
- Functions that use data exclusively from the Environmental Protection Commission (EPC) of Hillsborough County
- Functions that use data from Manatee, Pasco, Polk, or Hillsborough (Environmental Services Division) Counties
- Functions that use data from several monitoring programs for baywide reporting focusing exclusively on Enterococcus
This vignette is organized around these three workflows. For all, the assessments are meant to inform progress remediating fecal impairments or to support prioritization of areas for further investigation. They are not meant to support beach monitoring efforts or closures for recreational uses - alternative reporting products are available for that purpose (see FLDOH Healthy Beaches or the Tampa Bay Recreational Water Quality Map).
EPC reporting
The Environmental Protection Commission (EPC) of Hillsborough County has been tracking FIB indicators for several decades as part of their long-term monitoring. Functions in tbeptools can be used to download EPC FIB data, analyze the results, and create summary maps or plots. Most of these functions are focused on reporting for the Hillsborough River fecal bacteria impairment and the associated Basin Management Action Plan (BMAP). These tools can be used to track long-term changes in FIBs in this basin to assess progress in reducing bacterial levels.
Data collected from the monitoring program are processed and
maintained in a spreadsheet titled
RWMDataSpreadsheet_ThroughCurrentReportMonth.xlsx available
for direct download here
and viewable here.
These data include observations at all stations and for all parameters
throughout the period of record. FIB data are collected at most stations
where additional water quality data are collected. This is the same
dataset used for reporting on water quality indicators in Tampa Bay (see
the water
quality data vignette). The functions in tbeptools can be used to
import and analyze these data.
Read
The main function for importing EPC FIB data is
read_importfib(). This function downloads the latest file
if one is not already available at the location specified by the
xlsx input argument. The function operates similarly as
read_importwq() for importing water quality data. Please
refer to the water
quality data vignette for additional details on the import
function.
The FIB data can be downloaded as follows:
fibdata <- read_importfib(xlsx = 'vignettes/current_data.xlsx', download_latest = T)A data object called fibdata is also provided with the
package, although it may not contain the most current data available
from EPC. View the help
file for the download date.
fibdata
#> # A tibble: 31,081 × 18
#>    area   epchc_station class SampleTime             yr    mo Latitude Longitude
#>    <chr>          <dbl> <chr> <dttm>              <dbl> <dbl>    <dbl>     <dbl>
#>  1 Hills…             2 3M    2026-01-13 14:19:00  2026     1     27.9     -82.5
#>  2 Hills…             6 3M    2026-01-28 09:36:00  2026     1     27.9     -82.5
#>  3 Hills…             7 3M    2026-01-28 09:50:00  2026     1     27.9     -82.5
#>  4 Hills…             8 3M    2026-01-28 13:10:00  2026     1     27.9     -82.4
#>  5 Middl…             9 2     2026-01-28 12:04:00  2026     1     27.8     -82.4
#>  6 Middl…            11 2     2026-01-28 10:08:00  2026     1     27.8     -82.5
#>  7 Middl…            13 2     2026-01-28 10:22:00  2026     1     27.8     -82.5
#>  8 Middl…            14 2     2026-01-28 11:21:00  2026     1     27.8     -82.5
#>  9 Middl…            16 2     2026-01-28 09:44:00  2026     1     27.7     -82.5
#> 10 Middl…            19 2     2026-01-28 10:00:00  2026     1     27.7     -82.6
#> # ℹ 31,071 more rows
#> # ℹ 10 more variables: Total_Depth_m <dbl>, Sample_Depth_m <dbl>, ecoli <dbl>,
#> #   ecoli_q <chr>, entero <dbl>, entero_q <chr>, fcolif <dbl>, fcolif_q <chr>,
#> #   totcol <dbl>, totcol_q <chr>
The fibdata object includes monthly samples for FIB data
at select stations in the Hillsborough River basin. Some stations
include samples beginning in 1972. The default output for
read_importfib() returns all stations with FIB data from
EPC. If all = F for read_importfib(), only
stations with AreaName as Hillsborough River, Hillsborough
River Tributary, Alafia River, Alafia River Tributary, Lake
Thonotosassa, Lake Thonotosassa Tributary, and Lake Roberta are
returned. Values are returned for E. coli (ecoli),
Enterococcus (entero), Fecal Coliform
(fcolif), and Total Coliform (totcol). Units
are # of colonies per 100 mL of water (#/100mL). Qualifier
columns for each are also returned with the _q suffix.
Consult the source spreadsheet for interpretation of these codes.
Concentrations noted with < (below detection) or
> (above detection) in the raw data are reported as the
detection limit.
The fibdata object can be used for the remaining FIB
functions.
Analyze
Several analysis functions are provided for working with the EPC
data. These functions are used internally by the show
functions described below, but are presented here for an explanation of
how the data are processed.
The anlz_fibmap() function assigns categories to each
observation in fibdata for a selected month and year. These
results are then mapped using anlz_fibmap() (see below).
The categories are specific to E. coli or Enterococcus
and are assigned based on the station class as freshwater
(class as 1 or 3F) or marine (class as 2 or
3M), respectively. A station is categorized into one of four ranges
defined by the thresholds as noted in the cat column of the
output, with corresponding colors appropriate for each range as noted in
the col column of the output.
anlz_fibmap(fibdata)
#> # A tibble: 31,081 × 12
#>    area    station class    yr    mo Latitude Longitude ecoli entero ind   cat
#>    <chr>     <dbl> <chr> <dbl> <dbl>    <dbl>     <dbl> <dbl>  <dbl> <chr> <fct>
#>  1 Hillsb…       2 3M     2026     1     27.9     -82.5    NA     12 Ente… < 35
#>  2 Hillsb…       6 3M     2026     1     27.9     -82.5    NA      4 Ente… < 35
#>  3 Hillsb…       7 3M     2026     1     27.9     -82.5    NA      2 Ente… < 35
#>  4 Hillsb…       8 3M     2026     1     27.9     -82.4    NA      2 Ente… < 35
#>  5 Middle…       9 2      2026     1     27.8     -82.4    NA      2 Ente… < 35
#>  6 Middle…      11 2      2026     1     27.8     -82.5    NA      4 Ente… < 35
#>  7 Middle…      13 2      2026     1     27.8     -82.5    NA      2 Ente… < 35
#>  8 Middle…      14 2      2026     1     27.8     -82.5    NA      2 Ente… < 35
#>  9 Middle…      16 2      2026     1     27.7     -82.5    NA      4 Ente… < 35
#> 10 Middle…      19 2      2026     1     27.7     -82.6    NA      2 Ente… < 35
#> # ℹ 31,071 more rows
#> # ℹ 1 more variable: col <chr>
The ranges (number of samples / 100 mL) are from EPC and are as follows for E. coli or Enterococcus.
| Indicator | Color | Range |
|---|---|---|
| E. coli | Green | < 126 |
| Yellow | 126 - 409 | |
| Orange | 410 - 999 | |
| Red | > 999 | |
| Enterococcus | Green | < 35 |
| Yellow | 35 - 129 | |
| Orange | 130 - 999 | |
| Red | > 999 |
The yrsel and mosel arguments can be used
to filter results by year and month. Not specifying these arguments will
return results for the entire period of record.
anlz_fibmap(fibdata, yrsel = 2023, mosel = 7)
#> # A tibble: 150 × 12
#>    area    station class    yr    mo Latitude Longitude ecoli entero ind   cat
#>    <chr>     <dbl> <chr> <dbl> <dbl>    <dbl>     <dbl> <dbl>  <dbl> <chr> <fct>
#>  1 Hillsb…       2 3M     2023     7     27.9     -82.5    NA    800 Ente… 130 …
#>  2 Hillsb…       6 3M     2023     7     27.9     -82.5    NA      2 Ente… < 35
#>  3 Hillsb…       7 3M     2023     7     27.9     -82.5    NA      2 Ente… < 35
#>  4 Hillsb…       8 3M     2023     7     27.9     -82.4    NA      2 Ente… < 35
#>  5 Middle…       9 2      2023     7     27.8     -82.4    NA      2 Ente… < 35
#>  6 Middle…      11 2      2023     7     27.8     -82.5    NA      2 Ente… < 35
#>  7 Middle…      13 2      2023     7     27.8     -82.5    NA      2 Ente… < 35
#>  8 Middle…      14 2      2023     7     27.8     -82.5    NA      2 Ente… < 35
#>  9 Middle…      16 2      2023     7     27.7     -82.5    NA      2 Ente… < 35
#> 10 Middle…      19 2      2023     7     27.7     -82.6    NA      2 Ente… < 35
#> # ℹ 140 more rows
#> # ℹ 1 more variable: col <chr>
The areasel argument can indicate either
"Alafia" or "Hillsborough" to select stations
in the corresponding river basins, where rows in fibdata
are filtered based on the selection. All stations are returned if this
argument is NULL (default). The Alafia River basin includes
values in the area column of fibdata as
"Alafia River" and "Alafia River Tributary".
The Hillsborough River basin includes values in the area
column of fibdata as "Hillsborough River",
"Hillsborough River Tributary",
"Lake Thonotosassa",
"Lake Thonotosassa Tributary", and
"Lake Roberta". Not all areas may be present based in the
selection for yrsel and mosel. All valid
options for areasel include "Alafia River",
"Hillsborough River", "Cockroach Bay",
"East Lake Outfall", "Hillsborough Bay",
"Little Manatee", "Lower Tampa Bay",
"McKay Bay", "Middle Tampa Bay",
"Old Tampa Bay", "Palm River",
"Tampa Bypass Canal", or "Valrico Lake".
anlz_fibmap(fibdata, yrsel = 2023, mosel = 7, areasel = 'Hillsborough River')
#> # A tibble: 37 × 12
#>    area    station class    yr    mo Latitude Longitude ecoli entero ind   cat
#>    <chr>     <dbl> <chr> <dbl> <dbl>    <dbl>     <dbl> <dbl>  <dbl> <chr> <fct>
#>  1 Hillsb…       2 3M     2023     7     27.9     -82.5    NA    800 Ente… 130 …
#>  2 Hillsb…     105 3M     2023     7     28.0     -82.4    NA    128 Ente… 35 -…
#>  3 Hillsb…     106 1      2023     7     28.1     -82.4   144    232 E. c… 126 …
#>  4 Lake T…     107 3F     2023     7     28.0     -82.3   570   1550 E. c… 410 …
#>  5 Hillsb…     108 3F     2023     7     28.1     -82.2   187    276 E. c… 126 …
#>  6 Lake T…     118 3F     2023     7     28.1     -82.3     4      7 E. c… < 126
#>  7 Hillsb…     120 3F     2023     7     28.1     -82.4   100    410 E. c… < 126
#>  8 Lake T…     135 3F     2023     7     28.1     -82.3     4      4 E. c… < 126
#>  9 Hillsb…     137 3M     2023     7     28.0     -82.5    NA    680 Ente… 130 …
#> 10 Hillsb…     143 3F     2023     7     28.1     -82.1   800   1333 E. c… 410 …
#> # ℹ 27 more rows
#> # ℹ 1 more variable: col <chr>
The anlz_fibmatrix() function creates a summary of FIB
categories by station and year as output for the
show_fibmatrix() function described below. The function
assigns Microbial Water Quality Assessment (MWQA) letter categories for
each station and year based on the likelihood that Enterococcus
(marine) concentrations will exceed 130 CFU / 100 mL or E. coli
(fresh) concentrations will exceed 410 CFU / 100 mL. By default, the
results for each year are based on a right-centered window that uses the
previous two years and the current year to calculate probabilities from
the monthly samples (lagyr = 3). The columns for each
station and year include the estimated geometric mean of the indicator
concentrations (gmean) and a category indicating a letter
outcome based on the likelihood of exceedences (cat).
anlz_fibmatrix(fibdata)
#> # A tibble: 120 × 7
#>       yr grp   class  gmean Latitude Longitude cat
#>    <dbl> <fct> <chr>  <dbl>    <dbl>     <dbl> <chr>
#>  1  2003 105   Marine  97.1     28.0     -82.4 C
#>  2  2003 152   Marine 266.      28.0     -82.5 D
#>  3  2003 137   Marine 342.      28.0     -82.5 D
#>  4  2004 105   Marine 216.      28.0     -82.4 C
#>  5  2004 152   Marine 246.      28.0     -82.5 C
#>  6  2004 137   Marine 302.      28.0     -82.5 D
#>  7  2005 105   Marine 117.      28.0     -82.4 C
#>  8  2005 152   Marine  91.7     28.0     -82.5 C
#>  9  2005 137   Marine  66.6     28.0     -82.5 C
#> 10  2006 105   Marine  90.7     28.0     -82.4 C
#> # ℹ 110 more rows
Show
The show_fibmap() function creates a map of FIB sites
and thresholds based on output from anlz_fibmap(). The same
arguments that apply to anlz_fibmap() also apply to
show_fibmap() such that freshwater and marine stations
categorized by relevant thresholds are plotted by a selected year,
month, and area (if provided). Unlike anlz_fibmap(), the
yrsel and mosel arguments are required.
show_fibmap(fibdata, yrsel = 2023, mosel = 7, areasel = NULL)Sites for the Hillsborough or Alafia river basins can be shown using
the areasel argument.
show_fibmap(fibdata, yrsel = 2023, mosel = 7, areasel = 'Hillsborough River')
show_fibmap(fibdata, yrsel = 2023, mosel = 7, areasel = 'Alafia River')Additional information about a site can be seen by placing the cursor over a location. A map inset can also be seen by clicking the arrow on the bottom left of the map.
The show_fibmatrix() function creates a stoplight
graphic of summarized FIB data at selected stations for each year of
available data [1]. The matrix colors are
based on the likelihood that fecal bacteria concentrations exceed 130
CFU / 100 mL for Enterococcus (marine) and 410 CFU / 100 mL for
E. coli (fresh). The likelihoods are categorized as A, B, C, D,
or E (Microbial Water Quality Assessment or MWQA categories) with
corresponding colors, where the breakpoints for each category are
<10%, 10-30%, 30-50%, 50-75%, and >75% (right-closed) likelihood
of exceedence. Methods and rationale for this categorization scheme are
provided by the Florida Department of Environmental Protection, Figure 8
in [2] and [1].
show_fibmatrix(fibdata)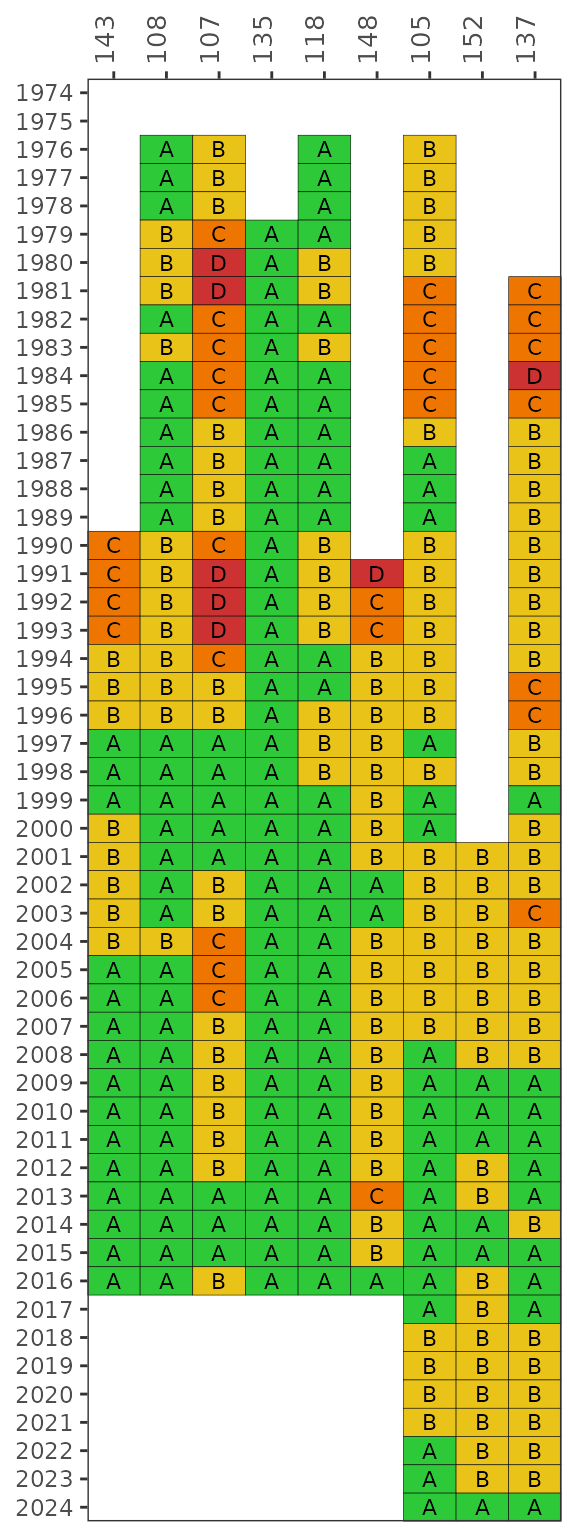
By default, the results for each year are based on a right-centered
window that uses the previous two years and the current year to
calculate probabilities from the monthly samples
(lagyr = 3). This example shows results using only the
monthly observations in each year.
show_fibmatrix(fibdata, lagyr = 1)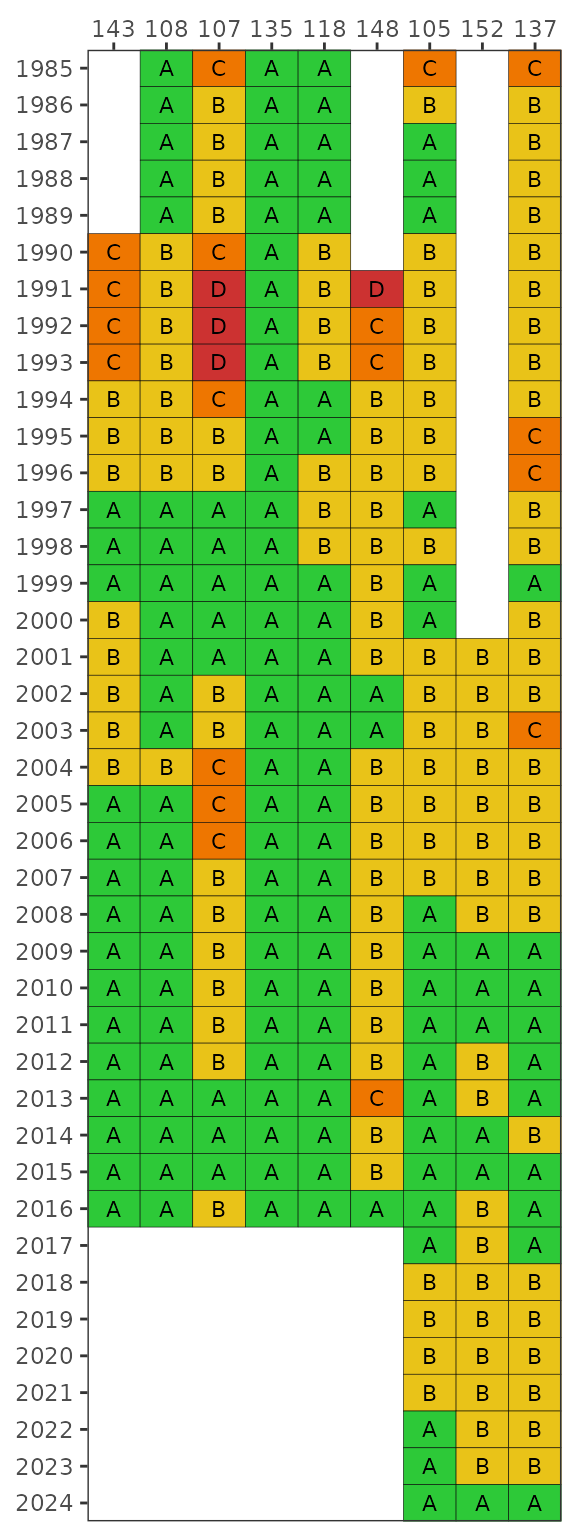
The default stations are those used in TBEP report #05-13 [3] for the Hillsborough River Basin Management
Action Plan (BMAP) subbasins. These include Blackwater Creek (WBID 1482,
EPC stations 143, 108), Baker Creek (WBID 1522C, EPC station 107), Lake
Thonotosassa (WBID 1522B, EPC stations 135, 118), Flint Creek (WBID
1522A, EPC station 148), and the Lower Hillsborough River (WBID 1443E,
EPC stations 105, 152, 137). Other stations in fibdata can
be plotted using the stas argument.
show_fibmatrix(fibdata, stas = c(115, 116))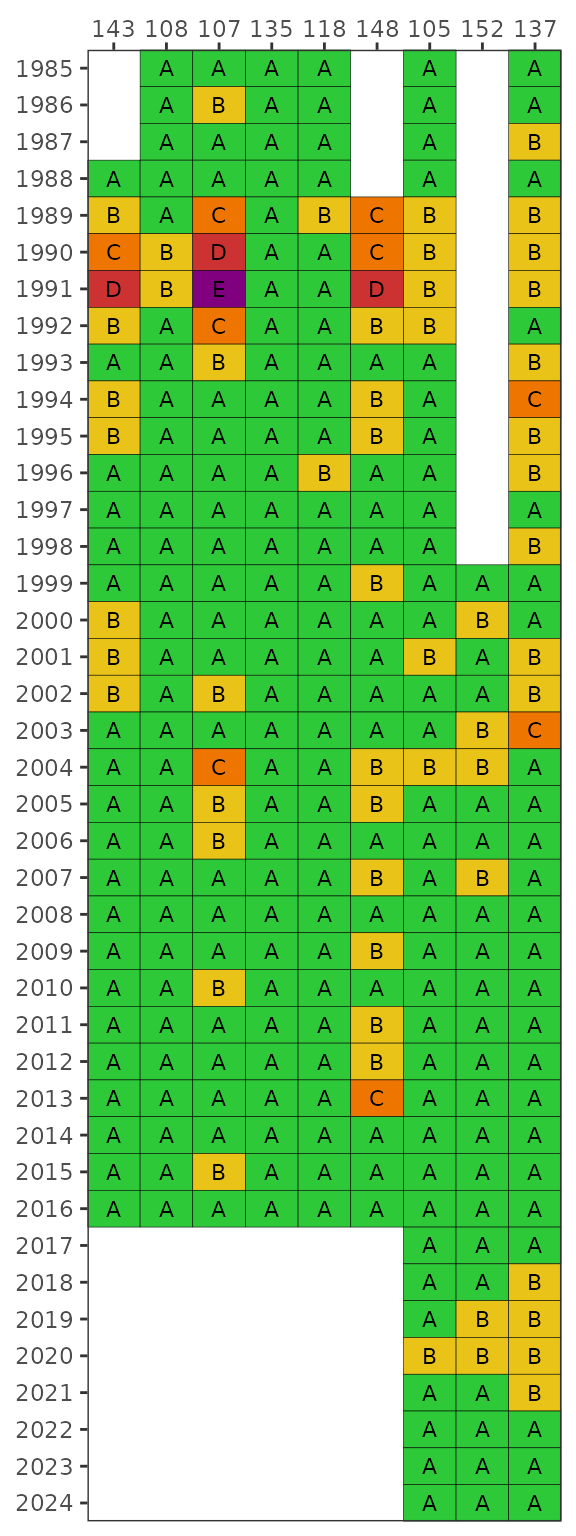
The yrrng argument can also be used to select a year
range, where the default is years with sufficient data for
Enterococcus at marine stations and E. coli for
freshwater stations.
show_fibmatrix(fibdata, yrrng = c(2010, 2020))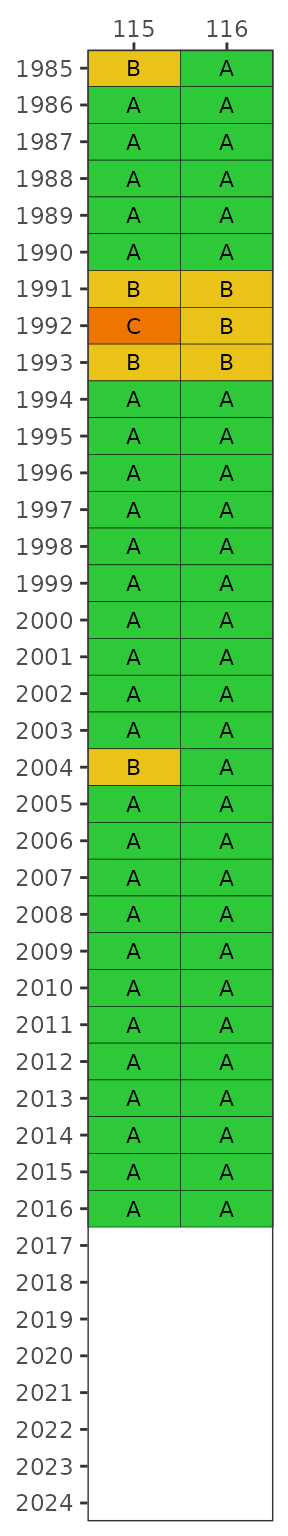
If preferred, the matrix can also be returned in an HTML table that
can be sorted and scrolled by setting asreact = TRUE. Only
the first ten rows are shown by default. The default number of rows (10)
can be changed with the nrows argument. Use a sufficiently
large number to show all rows.
show_fibmatrix(fibdata, asreact = TRUE)A plotly (interactive, dynamic plot) object can be returned by
setting plotly = TRUE.
show_fibmatrix(fibdata, plotly = TRUE)Finally, a map of station categories from the report card for a given
year can be plotted using show_fibmatmap(). The
yrsel argument is required, and the areasel
argument can be used to select a specific area. The values shown on the
map are the same as those for the respective year in the
show_fibmatrix() function.
show_fibmatmap(fibdata, yrsel = 2020, areasel = c('Hillsborough River', 'Alafia River'))Manatee, Pasco, Polk, or Hillsborough County reporting
FIB data from Manatee, Pasco, Polk, and Hillsborough (Environmental
Services Division) County can also be used with the above functions.
These data can be downloaded from the USEPA Water Quality Portal API as
follows, replacing the first argument with the appropriate organization
identifier (i.e., Manatee County 21FLMANA_WQP, Pasco County
21FLPASCO_WQP, Polk County 21FLPOLK_WQP).
mancofibdata <- read_importwqp(org = '21FLMANA_WQX', type = 'fib')For convenience, data objects with the same naming convention as
above are included with tbeptools for use with all FIB functions
(mancofibdata, pascofibdata,
polcofibdata, hcesdfibdata). Note that
read_importwqp() can be used to download FIB data from
other organizations, although the FIB functions will only work with data
from Manatee County.
Similar workflows as for the EPCHC data can be used. Examples of the functions using the Manatee County data are below. The same functionality can be used with the other county datasets.
show_fibmap(mancofibdata, yrsel = 2023, mosel = 7, areasel = NULL)
show_fibmatrix(mancofibdata, plotly = TRUE)
show_fibmatmap(mancofibdata, yrsel = 2020, areasel = 'Manatee River')Baywide reporting
The second workflow uses a baywide approach to summarize FIB data. Select stations were identified at downstream locations that drain into Tampa Bay and considered important watershed endpoints for FIB monitoring. Enterococcus is the primary indicator because these stations are located at terminal downstream locations that are tidally influenced (marine). The functions are organized similarly as the reporting workflow above, with some unique functions for working with data from these locations.
Read
The main function for importing Enterococcus data is
read_importentero(). This function retrieves data from the
USEPA Water Quality Portal API. The three arguments are
stas, startDate, and endDate. The
stas argument can be left as NULL (default) to
retrieve data from all stations based on those in the
catchprecip data object, described below. The
startDate and endDate arguments specify the
date ranges for retrieving data, where the input format for each is a
character string as 'YYYY-MM-DD'.
read_importentero(startDate = '1995-01-01', endDate = '2023-12-31')The data request can take some time and the enterodata
data object is provided with the package for use with all downstream
functions. This dataset includes all data from the 53 selected stations
from 1995-2023.
head(enterodata)
#>         date   yr mo time time_zone     long_name bay_segment          station
#> 1 2001-01-16 2001  1                Old Tampa Bay         OTB 21FLHILL_WQX-101
#> 2 2001-02-20 2001  2                Old Tampa Bay         OTB 21FLHILL_WQX-101
#> 3 2001-03-20 2001  3                Old Tampa Bay         OTB 21FLHILL_WQX-101
#> 4 2001-04-17 2001  4                Old Tampa Bay         OTB 21FLHILL_WQX-101
#> 5 2001-05-15 2001  5                Old Tampa Bay         OTB 21FLHILL_WQX-101
#> 6 2001-06-19 2001  6                Old Tampa Bay         OTB 21FLHILL_WQX-101
#>   entero entero_censored MDL entero_units qualifier LabComments Latitude
#> 1     80           FALSE  NA      #/100mL        NA          NA  28.0248
#> 2    360           FALSE  NA      #/100mL        NA          NA  28.0248
#> 3   3900           FALSE  NA      #/100mL        NA          NA  28.0248
#> 4     20           FALSE  NA      #/100mL        NA          NA  28.0248
#> 5     NA           FALSE  20                     NA          NA  28.0248
#> 6     NA           FALSE  20                     NA          NA  28.0248
#>   Longitude
#> 1  -82.6316
#> 2  -82.6316
#> 3  -82.6316
#> 4  -82.6316
#> 5  -82.6316
#> 6  -82.6316
The downstream functions also require precipitation data obtained
using the read_importrain() function. This function
downloads daily precipitation data from the Southwest Florida Water
Management District (SWFWMD) rainfall FTP
website. For each station, daily cumulative rainfall is summarized
for each upstream catchment, where the catchments for each site are
defined by pixel locations used to describe the SWFWMD rainfall data.
This information is available in the catchpixels data
object.
Rainfall data is downloaded by defining years and months of interest.
read_importrain(2021, catchpixels, mos = 1:12, quiet = F)As for the enterodata data object, the
catchprecip object is provided with the package for use
with all downstream functions. This dataset includes daily rainfall data
(inches) for the 53 selected stations from 1995-2023. The rainfall data
is used to define Enterococcus samples as “wet” or “dry” based
on default or user-defined thresholds described below.
head(catchprecip)
#> # A tibble: 6 × 3
#>   station            date        rain
#>   <chr>              <date>     <dbl>
#> 1 21FLCOSP_WQX-32-03 1995-01-01 0
#> 2 21FLCOSP_WQX-32-03 1995-01-02 0
#> 3 21FLCOSP_WQX-32-03 1995-01-03 0
#> 4 21FLCOSP_WQX-32-03 1995-01-04 0.389
#> 5 21FLCOSP_WQX-32-03 1995-01-05 0
#> 6 21FLCOSP_WQX-32-03 1995-01-06 0.106
Analyze
Several analysis functions are provided for working with
Enterococcus data. These functions are used internally by the
show functions described below, but are presented here for
an explanation of how the data are processed.
Each function uses Enterococcus and precipitation data
provided by the enterodata and catchprecip
data objects. The latter dataset is used to define “wet” or “dry”
samples with the premise that Enterococcus concentrations are
higher in wet weather and it may be useful to distinguish these samples
to assess progress in achieving water quality restoration goals, i.e.,
rainfall may confound an assessment of management efforts to reduce
fecal contamination.
Each anlz function has optional arguments that define
the temporal_window and wet_threshold for
defining “wet” or “dry” samples, which are passed to the
anlz_fibwetdry() function. These arguments define a period
of time preceding a sample date and cumulative rainfall threshold within
the time period that must be met to define a sample as “wet”. These
arguments default to two days and half an inch, such that samples are
defined as “wet” if they have greater than half an inch of cumulative
rainfall in the two days preceding and including the sample date. The
time and rainfall thresholds can be changed by the user. Additionally,
the anlz functions can also treat all samples equally by
ignoring any rainfall data by setting wetdry = FALSE, which
is the default behavior.
The anlz_fibwetdry() function defines “wet” or “dry”
samples as described above and returns the original input dataset with
three additional columns describing the total rain (inches) on the day
of sampling (rain_sampleDay), the total rain in the period
defined by the temporal_window argument
(rain_total), and whether the sample is “wet” or not as a
logical value (wet_sample).
anlz_fibwetdry(enterodata, catchprecip, temporal_window = 2, wet_threshold = 0.5)
#> # A tibble: 6,885 × 19
#>    date          yr    mo time  time_zone long_name   bay_segment station entero
#>    <date>     <dbl> <dbl> <chr> <chr>     <chr>       <chr>       <chr>    <dbl>
#>  1 2001-01-16  2001     1 ""    ""        Old Tampa … OTB         21FLHI…     80
#>  2 2001-02-20  2001     2 ""    ""        Old Tampa … OTB         21FLHI…    360
#>  3 2001-03-20  2001     3 ""    ""        Old Tampa … OTB         21FLHI…   3900
#>  4 2001-04-17  2001     4 ""    ""        Old Tampa … OTB         21FLHI…     20
#>  5 2001-05-15  2001     5 ""    ""        Old Tampa … OTB         21FLHI…     NA
#>  6 2001-06-19  2001     6 ""    ""        Old Tampa … OTB         21FLHI…     NA
#>  7 2001-07-24  2001     7 ""    ""        Old Tampa … OTB         21FLHI…   1300
#>  8 2001-08-21  2001     8 ""    ""        Old Tampa … OTB         21FLHI…    260
#>  9 2001-09-18  2001     9 ""    ""        Old Tampa … OTB         21FLHI…    420
#> 10 2001-10-16  2001    10 ""    ""        Old Tampa … OTB         21FLHI…    520
#> # ℹ 6,875 more rows
#> # ℹ 10 more variables: entero_censored <lgl>, MDL <int>, entero_units <chr>,
#> #   qualifier <lgl>, LabComments <lgl>, Latitude <dbl>, Longitude <dbl>,
#> #   rain_sampleDay <dbl>, rain_total <dbl>, wet_sample <lgl>
The remaining anlz functions are
anlz_enteromap() to prepare data for mapping and
anlz_fibmatrix() to prepare data for a score card. Both can
optionally use anlz_fibwetdry() to plot “wet” or “dry”
samples, described further in the show section.
The anlz_enteromap() function is an
Enterococcus-specific analogue to the
anlz_fibmap() function described in the EPC section above.
The function assigns categories to each observation in the
Enterococcus data frame, which can be viewed for a given month
and year using show_enteromap() (analagous to
show_fibmap()). The categories are specific to
Enterococcus in marine waters, and are noted in the
cat column of the output. Corresponding colors are in the
col column of the output.
anlz_enteromap(enterodata)
#> # A tibble: 6,885 × 12
#>    station     long_name    yr    mo Latitude Longitude entero cat   col   ind
#>    <chr>       <chr>     <dbl> <dbl>    <dbl>     <dbl>  <dbl> <fct> <chr> <chr>
#>  1 21FLHILL_W… Old Tamp…  2001     1     28.0     -82.6     80 35 -… #E9C… Ente…
#>  2 21FLHILL_W… Old Tamp…  2001     2     28.0     -82.6    360 130 … #EE7… Ente…
#>  3 21FLHILL_W… Old Tamp…  2001     3     28.0     -82.6   3900 > 999 #CC3… Ente…
#>  4 21FLHILL_W… Old Tamp…  2001     4     28.0     -82.6     20 < 35  #2DC… Ente…
#>  5 21FLHILL_W… Old Tamp…  2001     5     28.0     -82.6     NA NA    NA    Ente…
#>  6 21FLHILL_W… Old Tamp…  2001     6     28.0     -82.6     NA NA    NA    Ente…
#>  7 21FLHILL_W… Old Tamp…  2001     7     28.0     -82.6   1300 > 999 #CC3… Ente…
#>  8 21FLHILL_W… Old Tamp…  2001     8     28.0     -82.6    260 130 … #EE7… Ente…
#>  9 21FLHILL_W… Old Tamp…  2001     9     28.0     -82.6    420 130 … #EE7… Ente…
#> 10 21FLHILL_W… Old Tamp…  2001    10     28.0     -82.6    520 130 … #EE7… Ente…
#> # ℹ 6,875 more rows
#> # ℹ 2 more variables: indnm <chr>, conc <dbl>
The ranges (number of samples / 100 mL) are from EPC and are as follows for Enterococcus:
| Color | Range |
|---|---|
| Green | < 35 |
| Orange | 130 - 999 |
| Red | > 999 |
| Yellow | 35 - 129 |
The yrsel and mosel arguments can be used
to filter results by year and month. Not specifying these arguments will
return results for the entire period of record.
anlz_enteromap(enterodata, yrsel = 2020, mosel = 8)
#> # A tibble: 27 × 12
#>    station     long_name    yr    mo Latitude Longitude entero cat   col   ind
#>    <chr>       <chr>     <dbl> <dbl>    <dbl>     <dbl>  <dbl> <fct> <chr> <chr>
#>  1 21FLHILL_W… Old Tamp…  2020     8     28.0     -82.6    220 130 … #EE7… Ente…
#>  2 21FLHILL_W… Old Tamp…  2020     8     28.0     -82.6     40 35 -… #E9C… Ente…
#>  3 21FLHILL_W… Old Tamp…  2020     8     28.0     -82.6     70 35 -… #E9C… Ente…
#>  4 21FLHILL_W… Old Tamp…  2020     8     28.0     -82.6     50 35 -… #E9C… Ente…
#>  5 21FLPDEM_W… Old Tamp…  2020     8     27.9     -82.7     20 < 35  #2DC… Ente…
#>  6 21FLHILL_W… Hillsbor…  2020     8     27.9     -82.4      8 < 35  #2DC… Ente…
#>  7 21FLHILL_W… Hillsbor…  2020     8     27.9     -82.4   1200 > 999 #CC3… Ente…
#>  8 21FLHILL_W… Hillsbor…  2020     8     27.8     -82.4    520 130 … #EE7… Ente…
#>  9 21FLHILL_W… Hillsbor…  2020     8     27.9     -82.5    190 130 … #EE7… Ente…
#> 10 21FLHILL_W… Hillsbor…  2020     8     27.9     -82.4     90 35 -… #E9C… Ente…
#> # ℹ 17 more rows
#> # ℹ 2 more variables: indnm <chr>, conc <dbl>
The wetdry argument can be used to determine whether a
sample was taken after a rain event (logical wet_sample
column in output), based on user-specified thresholds and a provided
precipitation data object (catchprecip). Below shows how to
identify wet samples based on at least 0.5 inches of rain occurring two
days prior to and including the sample date.
anlz_enteromap(enterodata, wetdry = TRUE, precipdata = catchprecip,
               temporal_window = 2, wet_threshold = 0.5)
#> # A tibble: 6,885 × 13
#>    station     long_name    yr    mo Latitude Longitude entero cat   col   ind
#>    <chr>       <chr>     <dbl> <dbl>    <dbl>     <dbl>  <dbl> <fct> <chr> <chr>
#>  1 21FLHILL_W… Old Tamp…  2001     1     28.0     -82.6     80 35 -… #E9C… Ente…
#>  2 21FLHILL_W… Old Tamp…  2001     2     28.0     -82.6    360 130 … #EE7… Ente…
#>  3 21FLHILL_W… Old Tamp…  2001     3     28.0     -82.6   3900 > 999 #CC3… Ente…
#>  4 21FLHILL_W… Old Tamp…  2001     4     28.0     -82.6     20 < 35  #2DC… Ente…
#>  5 21FLHILL_W… Old Tamp…  2001     5     28.0     -82.6     NA NA    NA    Ente…
#>  6 21FLHILL_W… Old Tamp…  2001     6     28.0     -82.6     NA NA    NA    Ente…
#>  7 21FLHILL_W… Old Tamp…  2001     7     28.0     -82.6   1300 > 999 #CC3… Ente…
#>  8 21FLHILL_W… Old Tamp…  2001     8     28.0     -82.6    260 130 … #EE7… Ente…
#>  9 21FLHILL_W… Old Tamp…  2001     9     28.0     -82.6    420 130 … #EE7… Ente…
#> 10 21FLHILL_W… Old Tamp…  2001    10     28.0     -82.6    520 130 … #EE7… Ente…
#> # ℹ 6,875 more rows
#> # ℹ 3 more variables: indnm <chr>, conc <dbl>, wet_sample <lgl>
The areasel argument can indicate one or any of the
major subwatersheds in Tampa Bay (excluding Terra Ceia Bay where no data
exist). For example, use Old Tampa Bay for stations in the
subwatershed of Old Tampa Bay, where rows in enterodata are
filtered based on the selection. All stations are returned if this
argument is set as NULL (default). All valid options for
areasel include "Old Tampa Bay",
"Hillsborough Bay", "Middle Tampa Bay",
"Lower Tampa Bay", "Boca Ciega Bay", or
"Manatee River".
anlz_enteromap(enterodata, yrsel = 2023, mosel = 7, areasel = 'Old Tampa Bay')
#> # A tibble: 12 × 12
#>    station     long_name    yr    mo Latitude Longitude entero cat   col   ind
#>    <chr>       <chr>     <dbl> <dbl>    <dbl>     <dbl>  <dbl> <fct> <chr> <chr>
#>  1 21FLHILL_W… Old Tamp…  2023     7     28.0     -82.6      5 < 35  #2DC… Ente…
#>  2 21FLHILL_W… Old Tamp…  2023     7     28.0     -82.6     30 < 35  #2DC… Ente…
#>  3 21FLHILL_W… Old Tamp…  2023     7     28.0     -82.6     70 35 -… #E9C… Ente…
#>  4 21FLHILL_W… Old Tamp…  2023     7     28.0     -82.6    220 130 … #EE7… Ente…
#>  5 21FLHILL_W… Old Tamp…  2023     7     28.0     -82.5     NA NA    NA    Ente…
#>  6 21FLHILL_W… Old Tamp…  2023     7     28.0     -82.6    467 130 … #EE7… Ente…
#>  7 21FLHILL_W… Old Tamp…  2023     7     28.0     -82.6   3900 > 999 #CC3… Ente…
#>  8 21FLPDEM_W… Old Tamp…  2023     7     28.0     -82.7    798 130 … #EE7… Ente…
#>  9 21FLPDEM_W… Old Tamp…  2023     7     27.9     -82.7    457 130 … #EE7… Ente…
#> 10 21FLPDEM_W… Old Tamp…  2023     7     27.9     -82.7   1860 > 999 #CC3… Ente…
#> 11 21FLPDEM_W… Old Tamp…  2023     7     27.9     -82.7     75 35 -… #E9C… Ente…
#> 12 21FLTPA_WQ… Old Tamp…  2023     7     28.0     -82.7   2613 > 999 #CC3… Ente…
#> # ℹ 2 more variables: indnm <chr>, conc <dbl>
The anlz_fibmatrix() function is used with the
show_fibmatrix() function and is used similarly as for the
EPC workflow described above. The function assigns Microbial Water
Quality Assessment (MWQA) letter categories for each station and year
based on the likelihood that Enterococcus concentrations will
exceed 130 CFU / 100 mL. By default, the results for each year are based
on a right-centered window that uses the previous two years and the
current year to calculate probabilities from the monthly samples
(lagyr = 3). The columns for each station and year include
the estimated geometric mean of fecal bacterial concentrations
(gmean) and a category indicating a letter outcome based on
the likelihood of exceedences (cat).
anlz_fibmatrix(enterodata)
#> # A tibble: 605 × 7
#>       yr grp                    class   gmean Latitude Longitude cat
#>    <dbl> <fct>                  <chr>   <dbl>    <dbl>     <dbl> <chr>
#>  1  2002 21FLDOH_WQX-MANATEE152 Marine   13.6     27.5     -82.7 A
#>  2  2003 21FLDOH_WQX-MANATEE152 Marine   18.9     27.5     -82.7 A
#>  3  2003 21FLHILL_WQX-101       Marine  297.      28.0     -82.6 D
#>  4  2003 21FLHILL_WQX-102       Marine  103.      28.0     -82.6 B
#>  5  2003 21FLHILL_WQX-103       Marine  359.      28.0     -82.6 D
#>  6  2003 21FLHILL_WQX-104       Marine 2327.      28.0     -82.6 D
#>  7  2003 21FLHILL_WQX-109       Marine   36.6     27.9     -82.4 B
#>  8  2003 21FLHILL_WQX-112       Marine   49.4     27.7     -82.4 B
#>  9  2003 21FLHILL_WQX-133       Marine  829.      27.9     -82.4 E
#> 10  2003 21FLHILL_WQX-136       Marine   60.7     27.7     -82.5 A
#> # ℹ 595 more rows
Show
The show_enteromap() function creates a map of
Enterococcus sites and thresholds based on output from
anlz_enteromap(). The same arguments that apply to
anlz_enteromap() also apply to
show_enteromap(), including classification of samples as
‘wet’ or not depending on specified thresholds. Wet and dry samples are
differentiated on the map by their shapes. Unlike
anlz_enteromap(), the yrsel and
mosel arguments are required.
show_enteromap(enterodata, yrsel = 2020, mosel = 9)
show_enteromap(enterodata, yrsel = 2020, mosel = 9, wetdry = TRUE,
               temporal_window = 2, wet_threshold = 0.5)
Additional information about a site can be seen by placing the cursor over a location. A map inset can also be seen by clicking the arrow on the bottom left of the map.
Sites for specific areas can be shown using the areasel
argument.
show_enteromap(enterodata, yrsel = 2023, mosel = 7, areasel = 'Old Tampa Bay')The show_fibmatrix() function creates a stoplight
graphic of summarized FIB data at selected stations for each year of
available data. The matrix color codes years and stations based on the
likelihood of fecal indicator bacteria concentrations exceeding 130 CFU
/ 100 mL for Enterococcus. The likelihoods are categorized as
A, B, C, D, or E (Microbial Water Quality Assessment or MWQA categories)
with corresponding colors, where the breakpoints for each category are
<10%, 10-30%, 30-50%, 50-75%, and >75% (right-closed). Methods and
rationale for this categorization scheme are provided by the Florida
Department of Environmental Protection, Figure 8 in [2] and [1]. All
stations are shown by default.
show_fibmatrix(enterodata)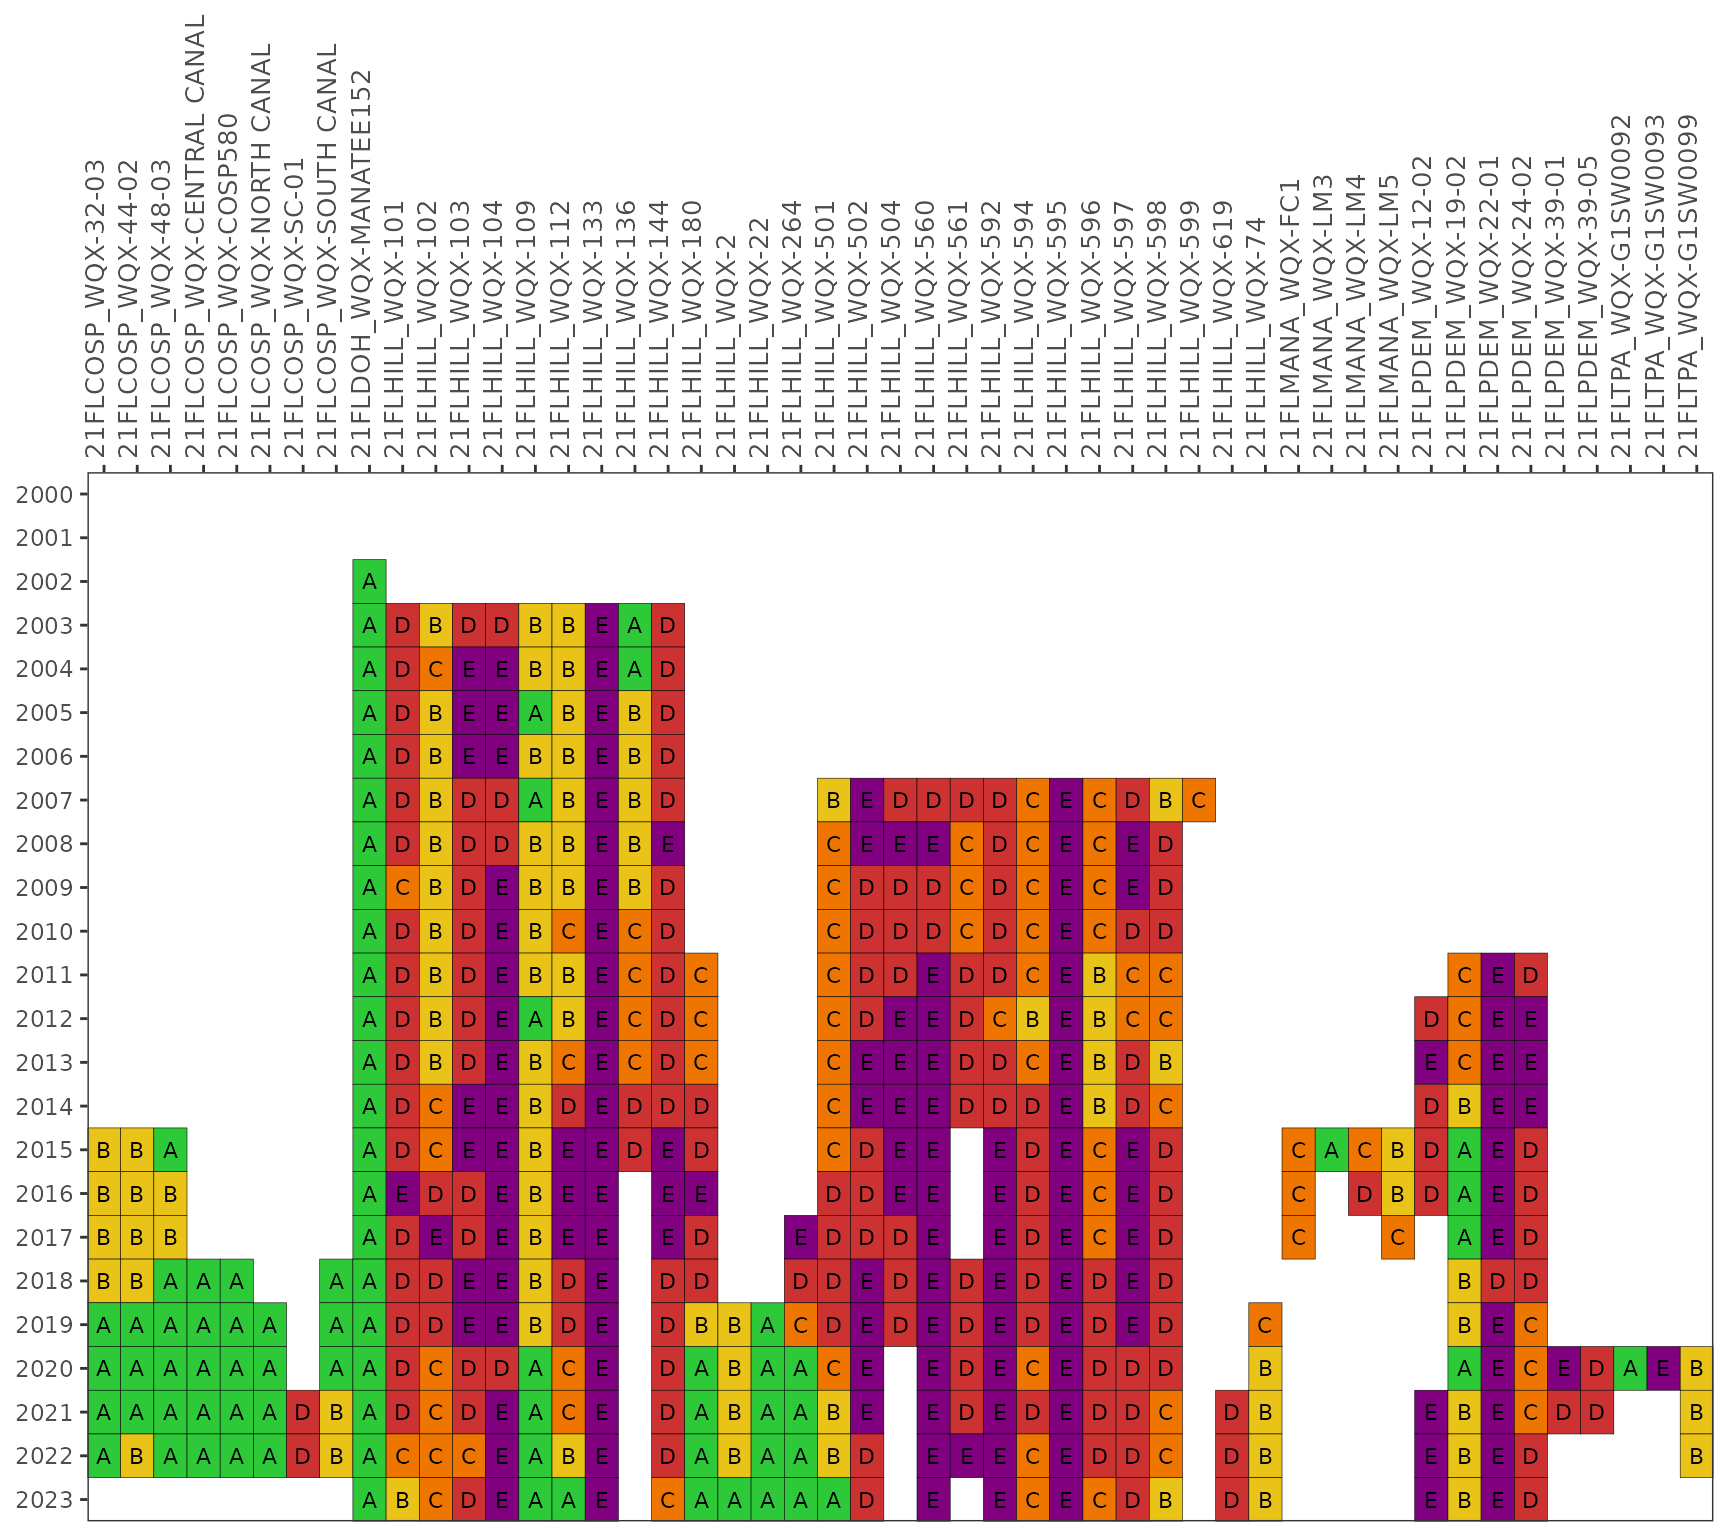
By default, the results for each year are based on a right-centered
window that uses the previous two years and the current year to
calculate probabilities from the monthly samples
(lagyr = 3). This example shows results using only the
monthly observations in each year.
show_fibmatrix(enterodata, lagyr = 1)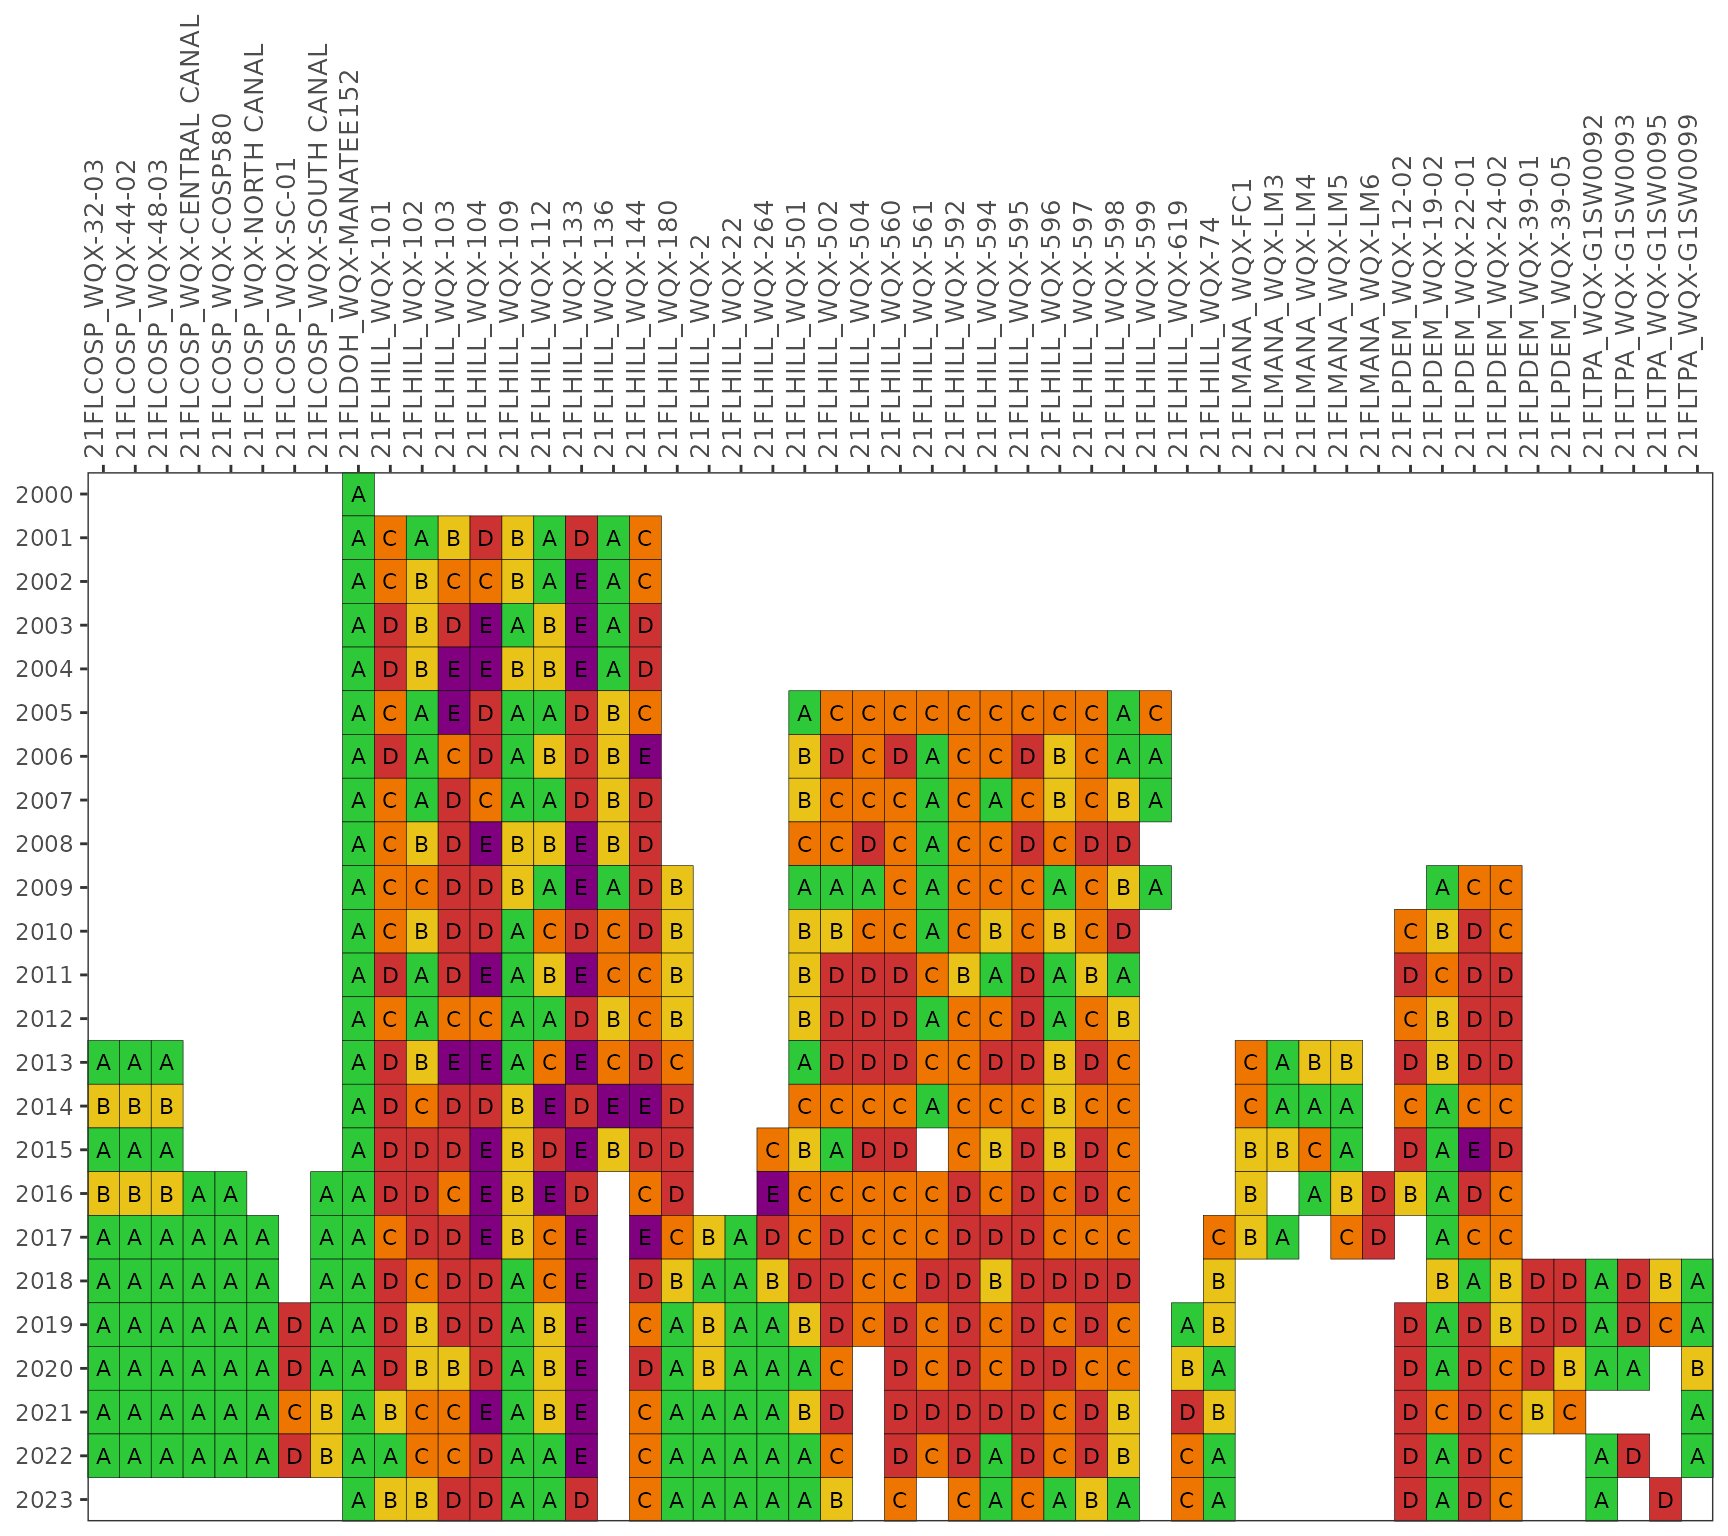
Individual stations can be selectd using the stas
argument.
show_fibmatrix(enterodata,
               stas = c('21FLHILL_WQX-101', '21FLHILL_WQX-102', '21FLHILL_WQX-103'))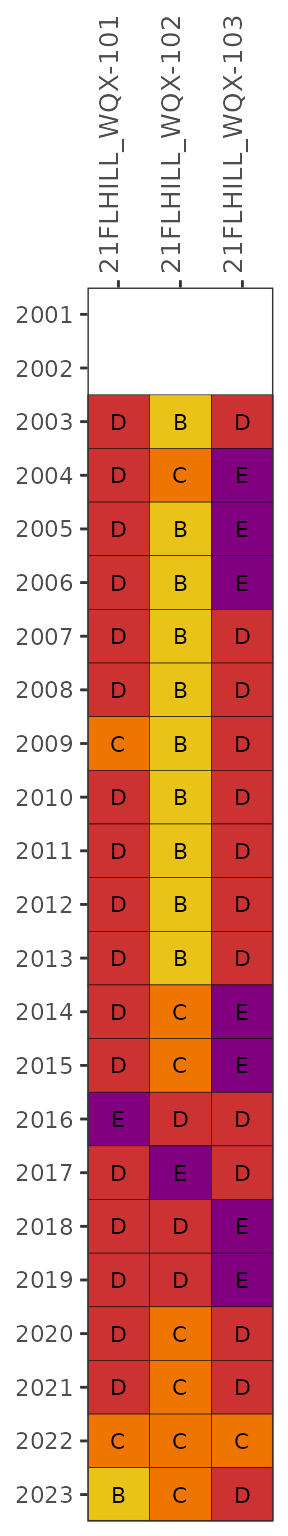
The yrrng argument can also be used to select a year
range, where the default is the date range contained in the data.
show_fibmatrix(enterodata, yrrng = c(2015, 2020))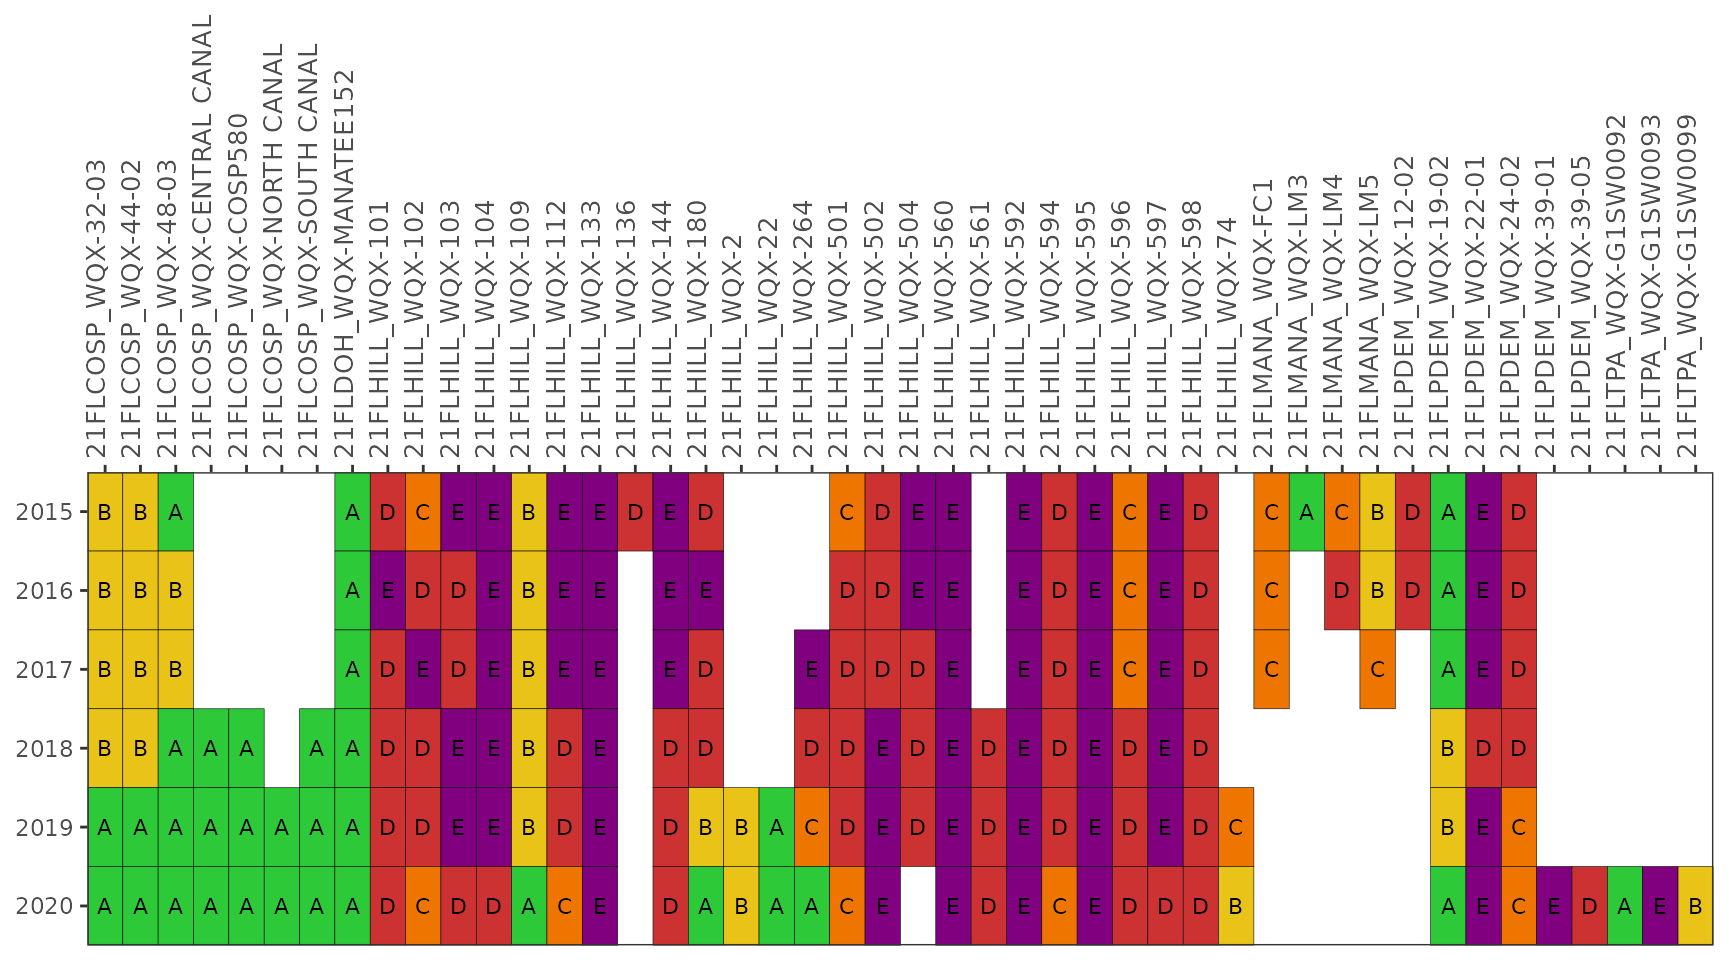
Note that the subset_wetdry argument can be used with
show_fibmatrix() to show only wet or dry samples based on
the thresholds provided by temporal_window and
wet_threshold. However, this is not recommended because the
scores are probability-based and comparisons between wet or dry samples
may be misleading due to different sample sizes, and therefore, power to
detect the likelihood of exceeding the threshold. Specifically, there
are far fewer wet samples than dry and these samples will generally
receive higher grades due to lower power of the statistical tests.
As for the EPC data, an HTML table can be returned with
show_fibmatrix() using asreact = TRUE and a
plotly object can be returned using plotly = TRUE. See the
above section for examples of these outputs.
The show_fibmatrix() function also supports baywide
reporting by bay segment, unlike the EPC data. The stations for the
baywide reporting were selected specifically as endpoints that drain
directly into each bay segment and an aggregate summary of the stations
by bay segment can indicate the MWQA category. The calculations are the
same as by station, but the data are aggregated by bay segment.
Care should be taken when communicating results at the bay segment scale to ensure appropriate messaging. Baywide scores could be misleading by using a handful of stations to communicate results at the bay segment scale. Reporting at this scale is meant to support assessments that are comparable to other similar indicators used by TBEP. A low grade for a bay segment does not imply hazardous conditions, rather the score reflects the aggregate likelihood for all stations selected for that bay segment. Remediation of conditions that contribute to fecal contamination is best handled at the site scale.
show_fibmatrix(enterodata, bay_segment = c('OTB', 'HB', 'MTB', 'LTB', 'BCB', 'MR'))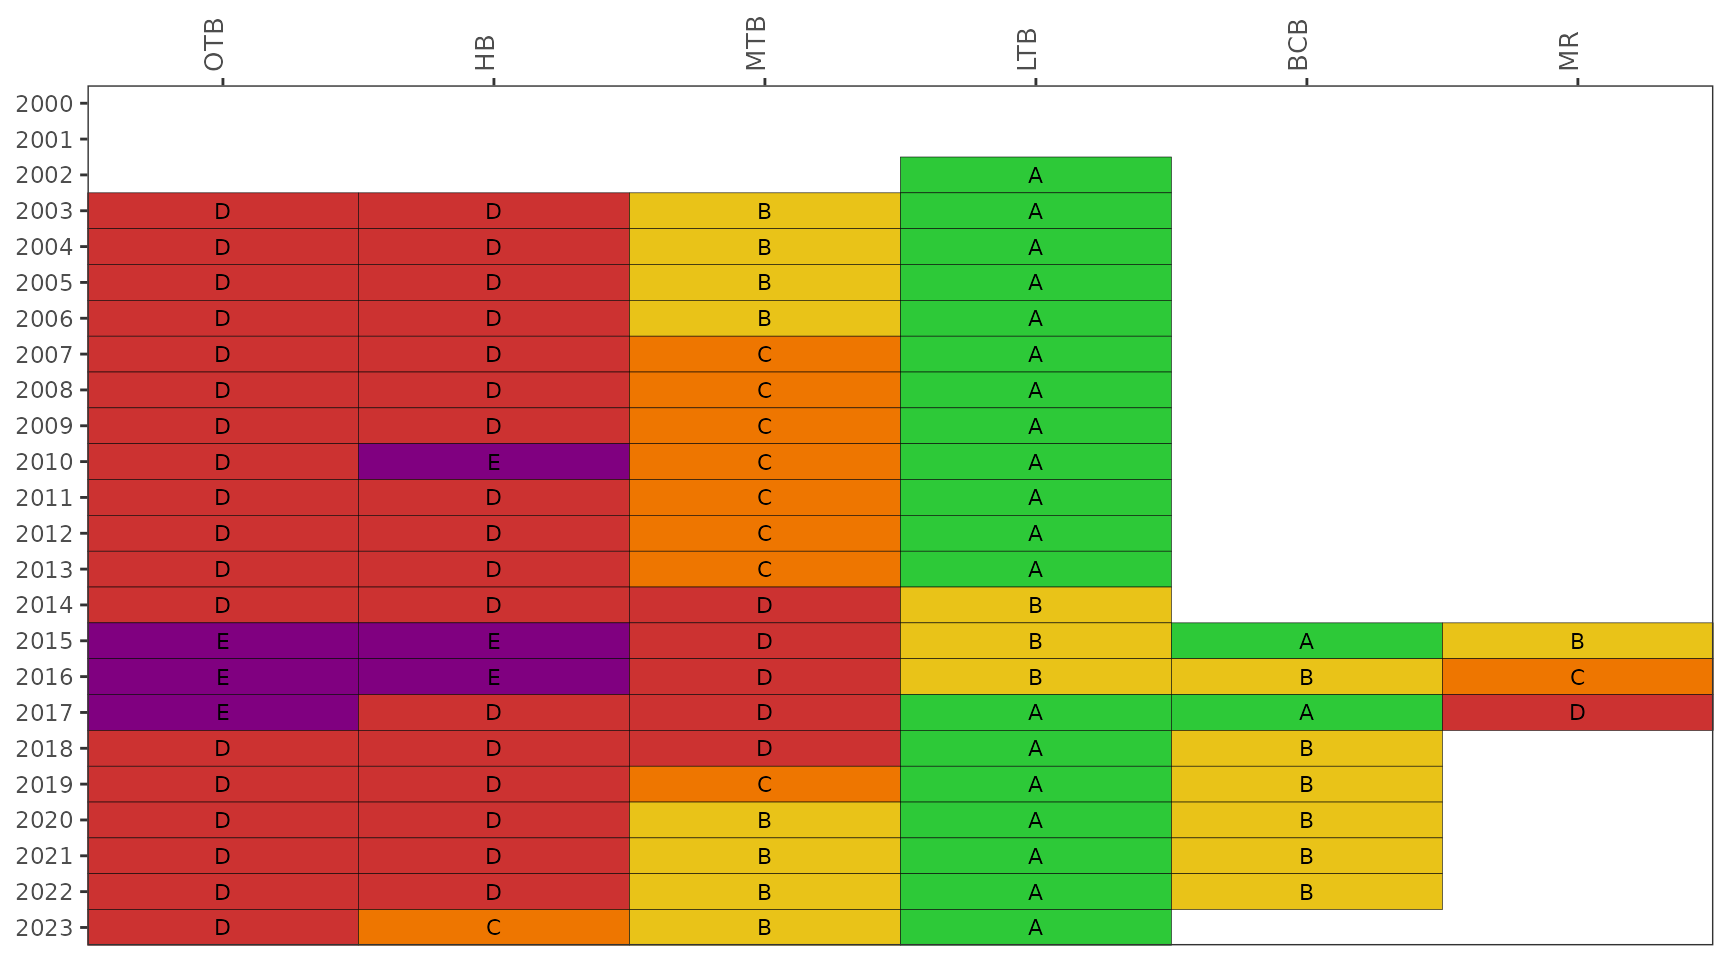
Finally, a map of station and bay segment categories for a given year
can be plotted using show_fibmatrixmap(). The
yrsel argument is required, and the areasel
argument can be used to select a specific area. The values shown on the
map are the same as those for the respective year in the
show_fibmatrix() function.
Note the use of the minor sub-basins for reporting the outcomes for each bay segment. The collection of sub-basins that include stations used to estimate the bay segment outcomes are shown and color-coded by the appropriate outcome for each bay segment. As noted above, care should be taken when communicating results at the bay segment scale.
show_fibmatmap(enterodata, yrsel = 2020, areasel = c('OTB', 'HB', 'MTB', 'LTB', 'BCB', 'MR'))Retrieving additional FIB data
The read_importwqp() function can be used to retrieve
data from the USEPA Water Quality Portal using an organization
identifier. The data can be retrieved as follows and will typically take
less than one minute to download.
# get Manatee County data
mancodata <- read_importwqp(org = '21FLDOH_WQX', type = 'fib', trace = T)

# get Pinellas County data
pincodata <- read_importwqp(org = '21FLPDEM_WQX', type = 'fib', trace = T)