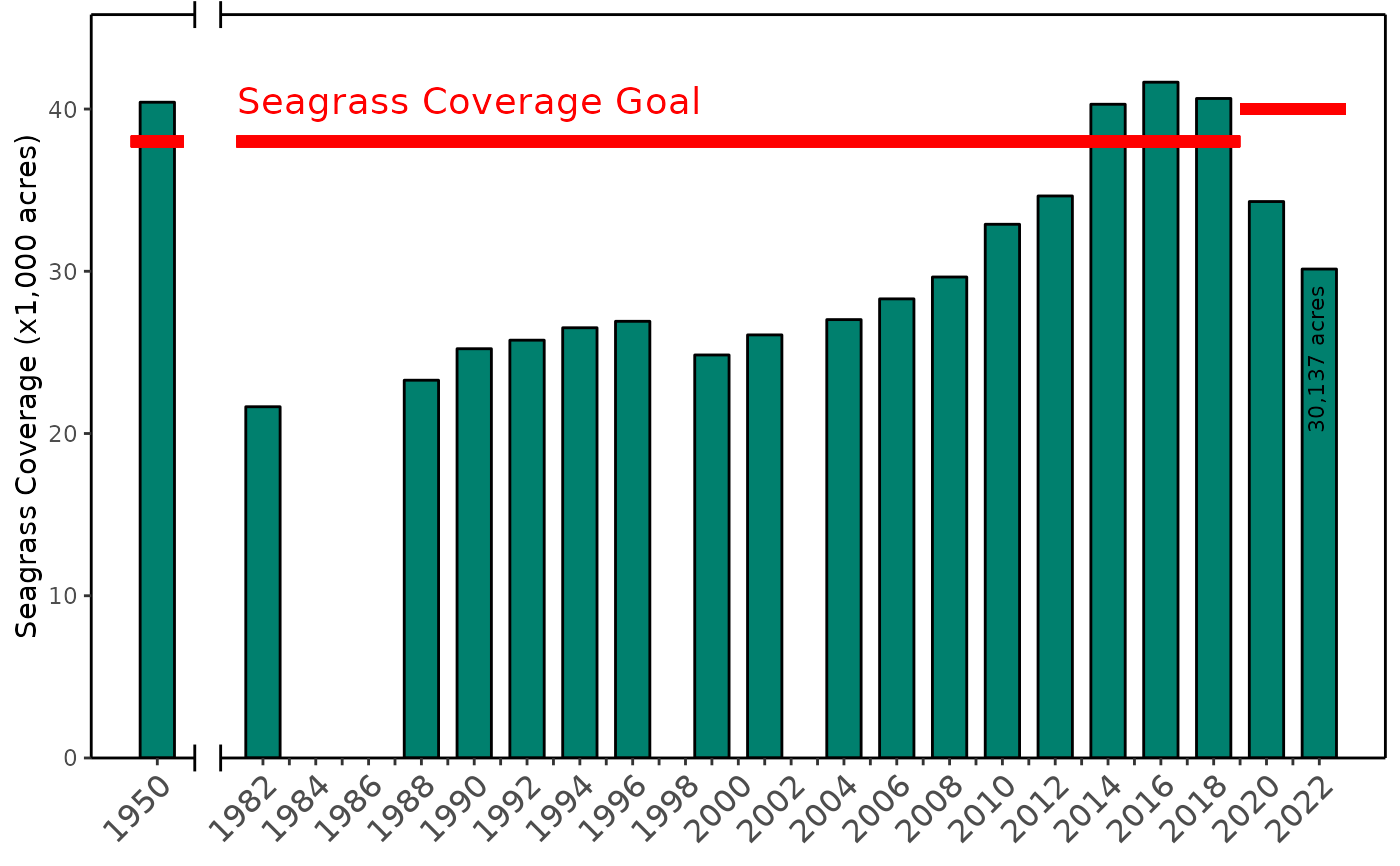
Create a barplot of seagrass coverage over time in Tampa Bay
Source:R/show_seagrasscoverage.R
show_seagrasscoverage.RdCreate a barplot of seagrass coverage over time in Tampa Bay
Usage
show_seagrasscoverage(
  seagrass,
  maxyr = 2024,
  family = "sans",
  lastlab = T,
  axsbrk = c(0.08, 0.1)
)
Arguments
- seagrass
input
data.frameincluded with the package asseagrass- maxyr
numeric for maximum year to plot
- family
optional chr string indicating font family for text labels
- lastlab
logical indicating if text label on
maxyrshould be included- axsbrk
numeric vector of length two indicating where the x-axis break occurs
Details
This function creates the flagship seagrass coverage graphic to report on coverage changes over time. All data were pre-processed and included in the package as the seagrass dataset. Original data are from the Southwest Florida Water Management District and available online at https://data-swfwmd.opendata.arcgis.com/. This function and the data used to create the plot are distinct from those used for the transect monitoring program.