Plot metal concentrations against aluminum
Arguments
- sedimentdata
input sediment
data.frameas returned byread_importsediment- param
chr string for which parameter to plot, must be a metal
- yrrng
numeric vector indicating min, max years to include, use single year for one year of data
- bay_segment
chr string for the bay segment, one to many of "HB", "OTB", "MTB", "LTB", "TCB", "MR", "BCB"
- funding_proj
chr string for the funding project, one to many of "TBEP" (default), "TBEP-Special", "Apollo Beach", "Janicki Contract", "Rivers", "Tidal Streams"
- lnsz
numeric for line size
- base_size
numeric indicating text scaling size for plot
- plotly
logical if matrix is created using plotly
- family
optional chr string indicating font family for text labels
- width
numeric for width of the plot in pixels, only applies of
plotly = TRUE- height
numeric for height of the plot in pixels, only applies of
plotly = TRUE
Value
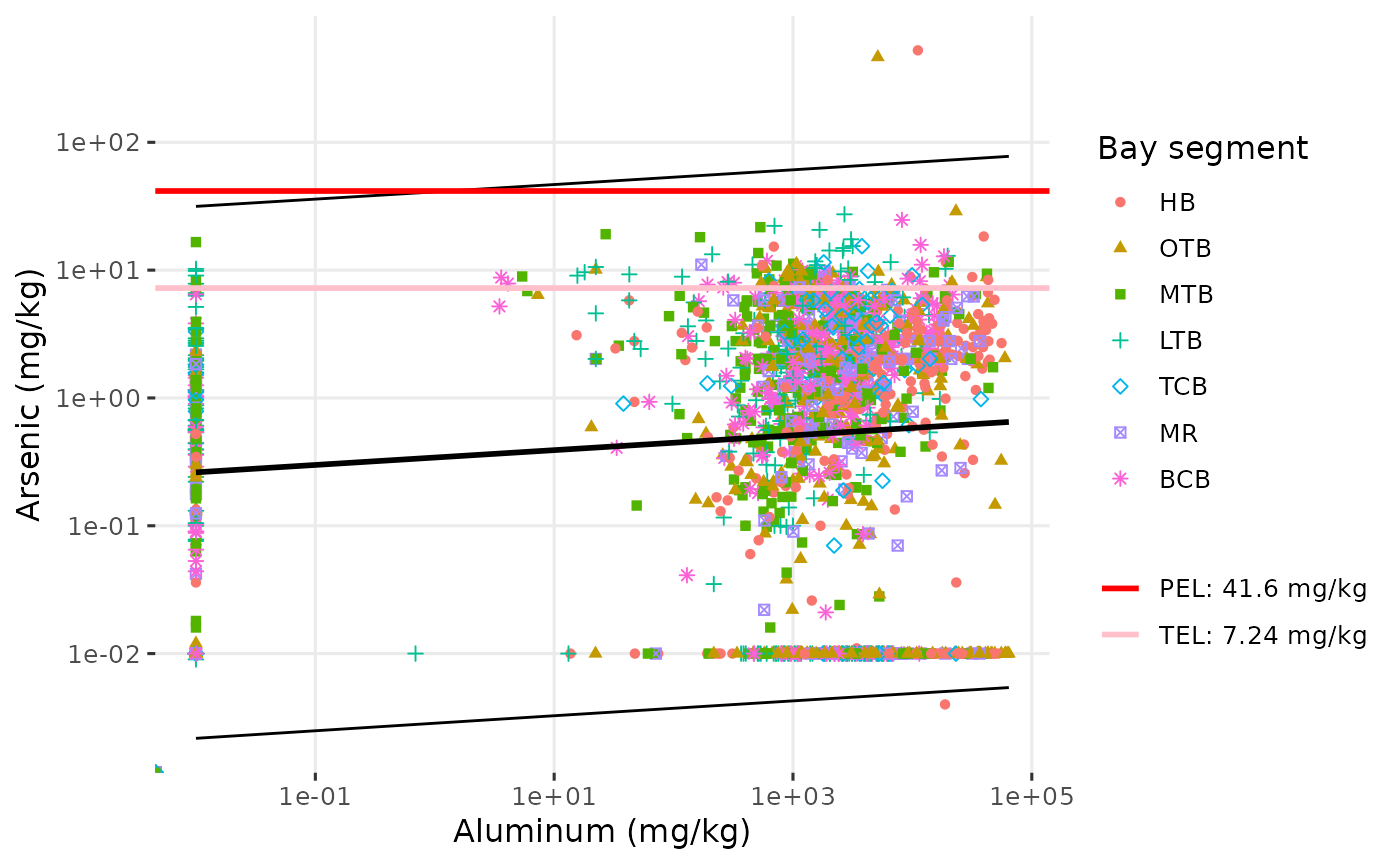
A ggplot object or a plotly object if plotly = TRUE showing the ratio of the selected parameter plotted against aluminum concentrations collected at the same site. Black lines show the linear fit of a log-log model and the 95% prediction intervals.
Details
The plot shows the selected contaminant concentration relative to aluminum, the latter being present as a common metal in the Earth's crust. An elevated ratio of a metal parameter relative to aluminum suggests it is higher than background concentrations.
Lines for the Threshold Effect Level (TEL) and Potential Effect Level (PEL) are shown for the parameter, if available.