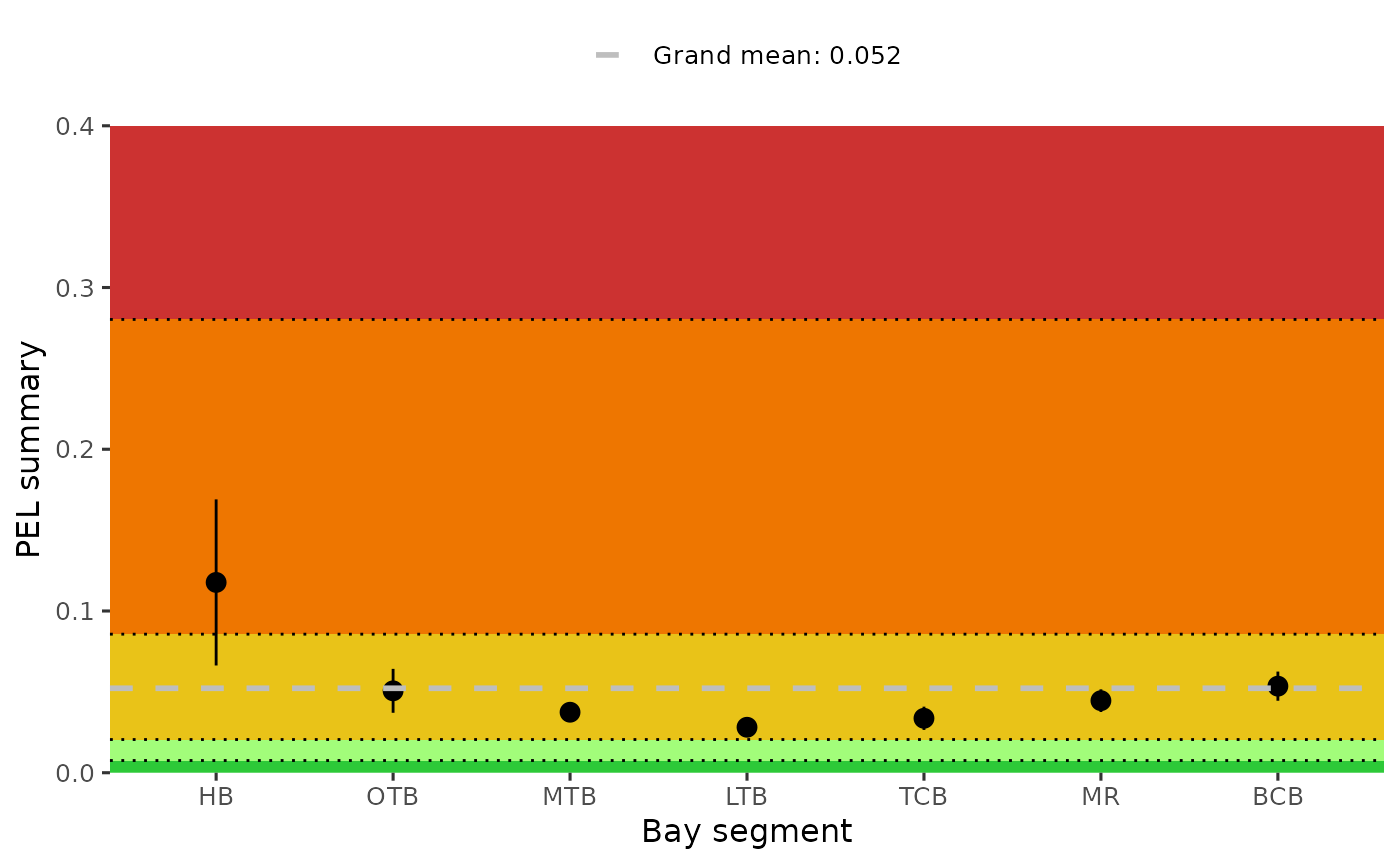
Plot summary of PEL averages by bay segment
Arguments
- sedimentdata
input sediment
data.frameas returned byread_importsediment- yrrng
numeric vector indicating min, max years to include, use single year for one year of data
- bay_segment
chr string for the bay segment, one to many of "HB", "OTB", "MTB", "LTB", "TCB", "MR", "BCB"
- funding_proj
chr string for the funding project, one to many of "TBEP" (default), "TBEP-Special", "Apollo Beach", "Janicki Contract", "Rivers", "Tidal Streams"
- alph
numeric indicating alpha value for score category colors
- ylim
numeric for y axis limits
- lnsz
numeric for line size
- base_size
numeric indicating text scaling size for plot
- plotly
logical if matrix is created using plotly
- family
optional chr string indicating font family for text labels
- width
numeric for width of the plot in pixels, only applies of
plotly = TRUE- height
numeric for height of the plot in pixels, only applies of
plotly = TRUE
Value
A ggplot object or a plotly object if plotly = TRUE showing PEL averages (average of the averages) and 95% confidence intervals for each bay segment