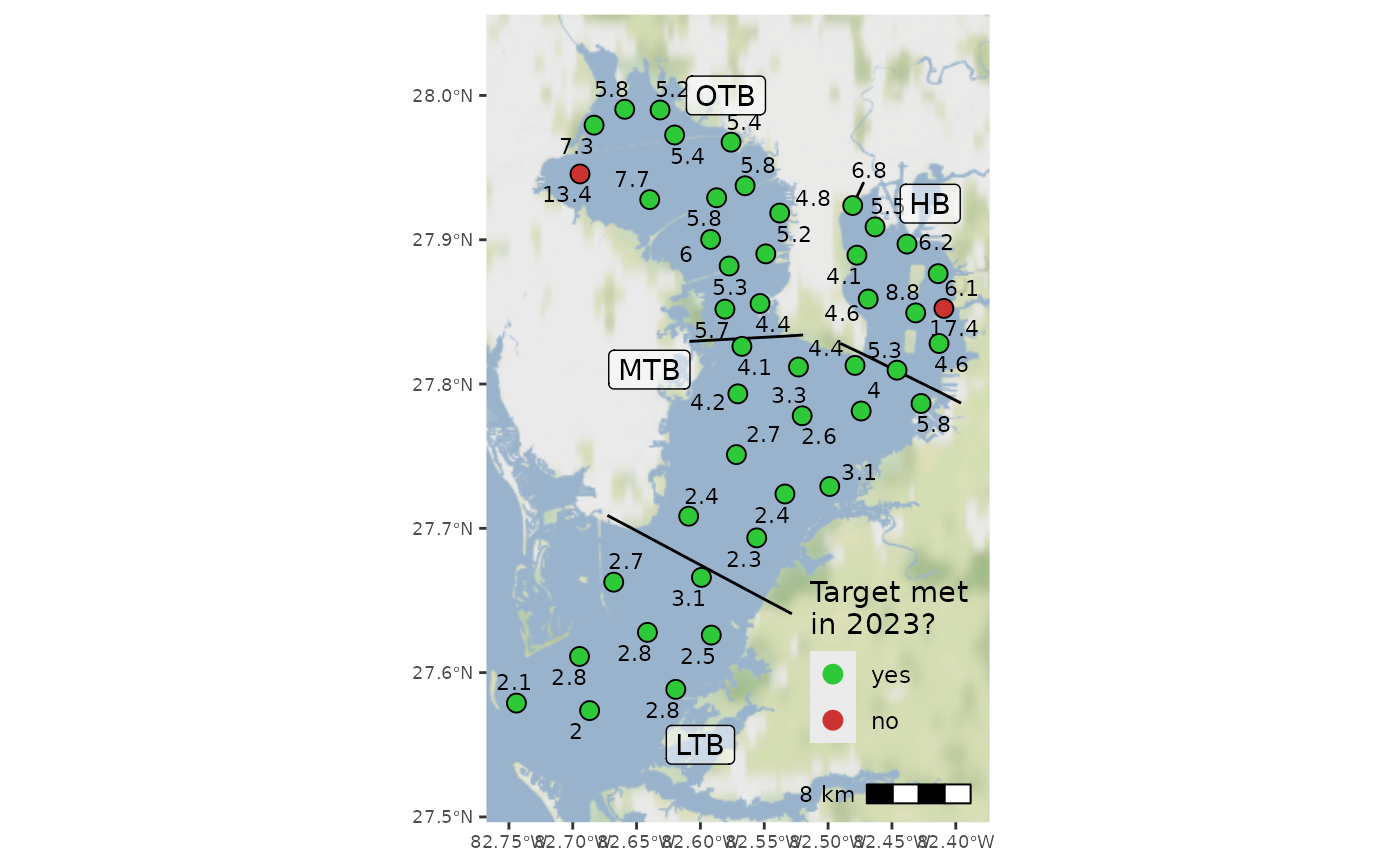
Map site attainment categories for a selected year
Arguments
- epcdata
data frame of epc data returned by
read_importwq- yrsel
numeric for year to plot
- mosel
optional numeric of length one or two for mapping results for a specific month or month range in a given year, default full year
- param
chr string for which parameter to plot, one of
"chla"for chlorophyll or"la"for light attenuation- trgs
optional
data.framefor annual bay segment water quality targets, defaults totargets, only applies ifmosel = c(1, 12)- thrs
logical indicating if attainment category is relative to targets (default) or thresholds, passed to
anlz_attainsite, only applies ifmosel = c(1, 12)- showseg
logical indicating of bay segment labels are included
- partialyr
logical indicating if incomplete annual data for the most recent year are approximated by five year monthly averages for each parameter, only applies if
mosel = c(1, 12)