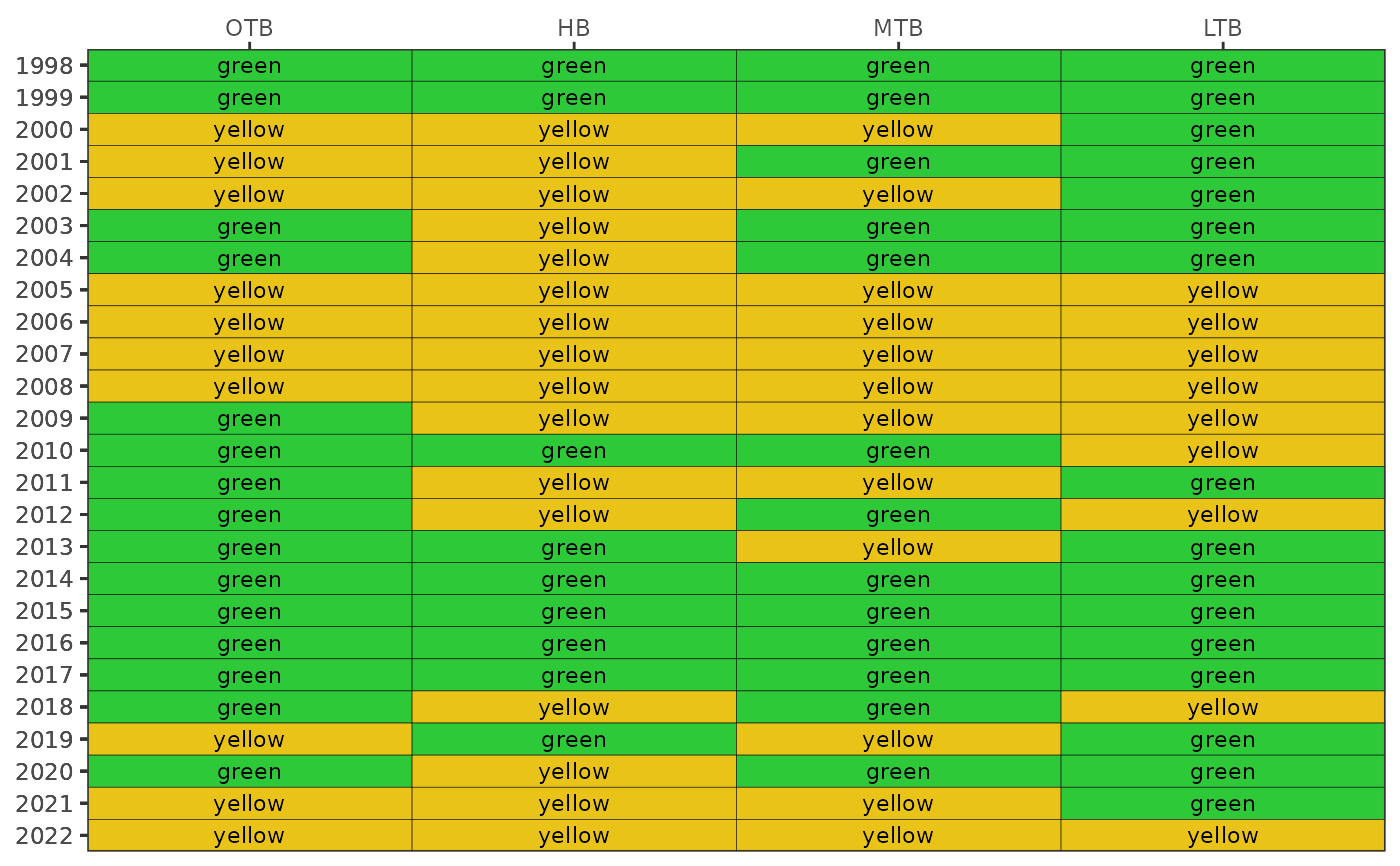
Plot a matrix of Tampa Bay Nekton Index scores over time by bay segment
Source:R/show_tbnimatrix.R
show_tbnimatrix.RdPlot a matrix of Tampa Bay Nekton Index scores over time by bay segment
Arguments
- tbniscr
input data frame as returned by
anlz_tbniscr- bay_segment
chr string for the bay segment, one to many of "OTB", "HB", "MTB", "LTB"
- perc
numeric values indicating break points for score categories
- alph
numeric indicating alpha value for score category colors
- txtsz
numeric for size of text in the plot
- family
optional chr string indicating font family for text labels
- rev
logical if factor levels for bay segments are reversed
- position
chr string of location for bay segment labels, default on top, passed to
scale_x_discrete- plotly
logical if matrix is created using plotly
- width
numeric for width of the plot in pixels, only applies of
plotly = TRUE- height
numeric for height of the plot in pixels, only applies of
plotly = TRUE
Value
A ggplot object showing trends over time in TBNI scores for each bay segment
Examples
tbniscr <- anlz_tbniscr(fimdata)
show_tbnimatrix(tbniscr)