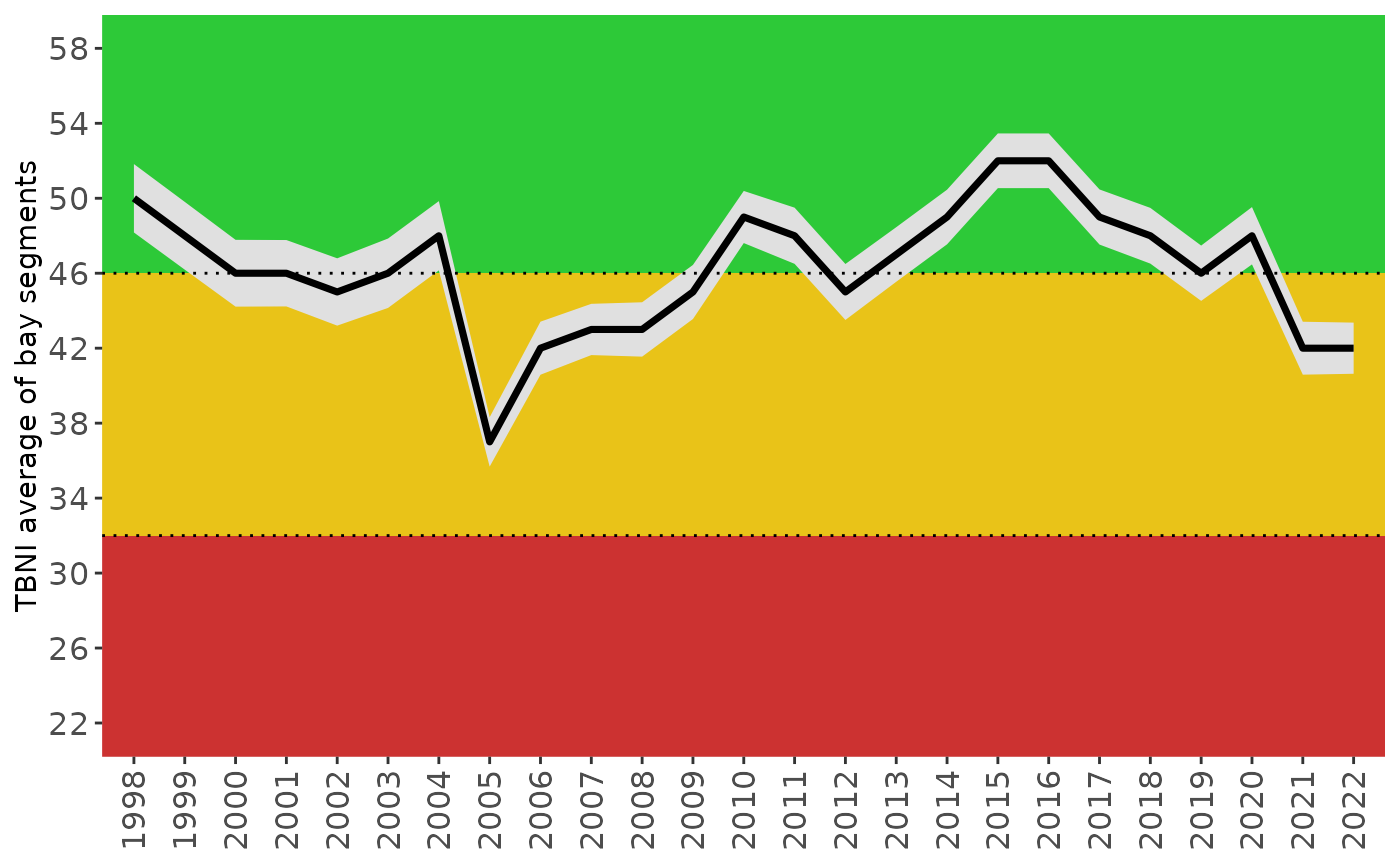
Plot Tampa Bay Nekton Index scores over time as average across bay segments
Source:R/show_tbniscrall.R
show_tbniscrall.RdPlot Tampa Bay Nekton Index scores over time as average across bay segments
Arguments
- tbniscr
input dat frame as returned by
anlz_tbniscr- perc
numeric values indicating break points for score categories
- alph
numeric indicating alpha value for score category colors
- ylim
numeric for y axis limits
- rev
logical if factor levels for bay segments are reversed
- plotly
logical if matrix is created using plotly
Value
A ggplot object showing trends over time in TBNI scores for each bay segment or a plotly object if plotly = TRUE
Examples
tbniscr <- anlz_tbniscr(fimdata)
show_tbniscrall(tbniscr)