Plot annual water quality values, targets, and thresholds for a segment
Source:R/show_thrplot.R
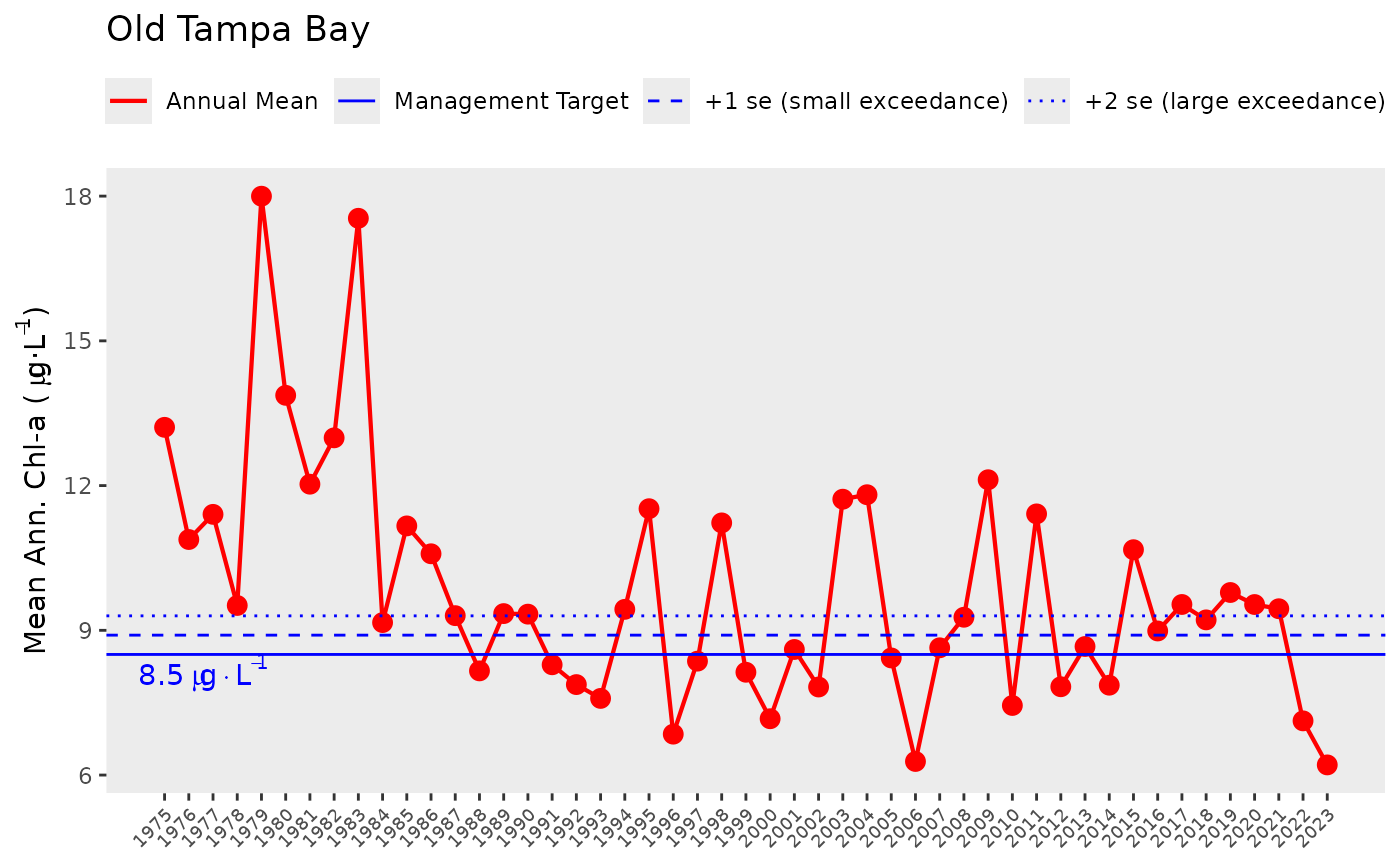
show_thrplot.RdPlot annual water quality values, targets, and thresholds for a bay segment
Arguments
- epcdata
data frame of epc data returned by
read_importwq- bay_segment
chr string for the bay segment, one of "OTB", "HB", "MTB", "LTB"
- thr
chr string indicating which water quality value and appropriate target/threshold to plot, one of "chl" for chlorophyll and "la" for light availability
- trgs
optional
data.framefor annual bay segment water quality targets/thresholds, defaults totargets- yrrng
numeric vector indicating min, max years to include
- family
optional chr string indicating font family for text labels
- labelexp
logical indicating if y axis and target labels are plotted as expressions, default
TRUE- txtlab
logical indicating if a text label for the target value is shown in the plot
- thrs
logical indicating if reference lines are shown only for the regulatory threshold
- partialyr
logical indicating if incomplete annual data for the most recent year are approximated by five year monthly averages for each parameter
Value
A ggplot object