Make a bar plot for transect training group comparisons
Arguments
- transect
data frame returned by
read_transect- yr
numeric for year of training data to plot
- site
chr string indicating site results to plot
- species
chr string indicating which species to plot
- varplo
chr string indicating which variable to plot
- base_size
numeric indicating text scaling size for plot
- xtxt
numeric indicating text size for x-axis labels
- size
numeric indicating line size
Value
A ggplot object
Examples
transect <- read_transect(training = TRUE)
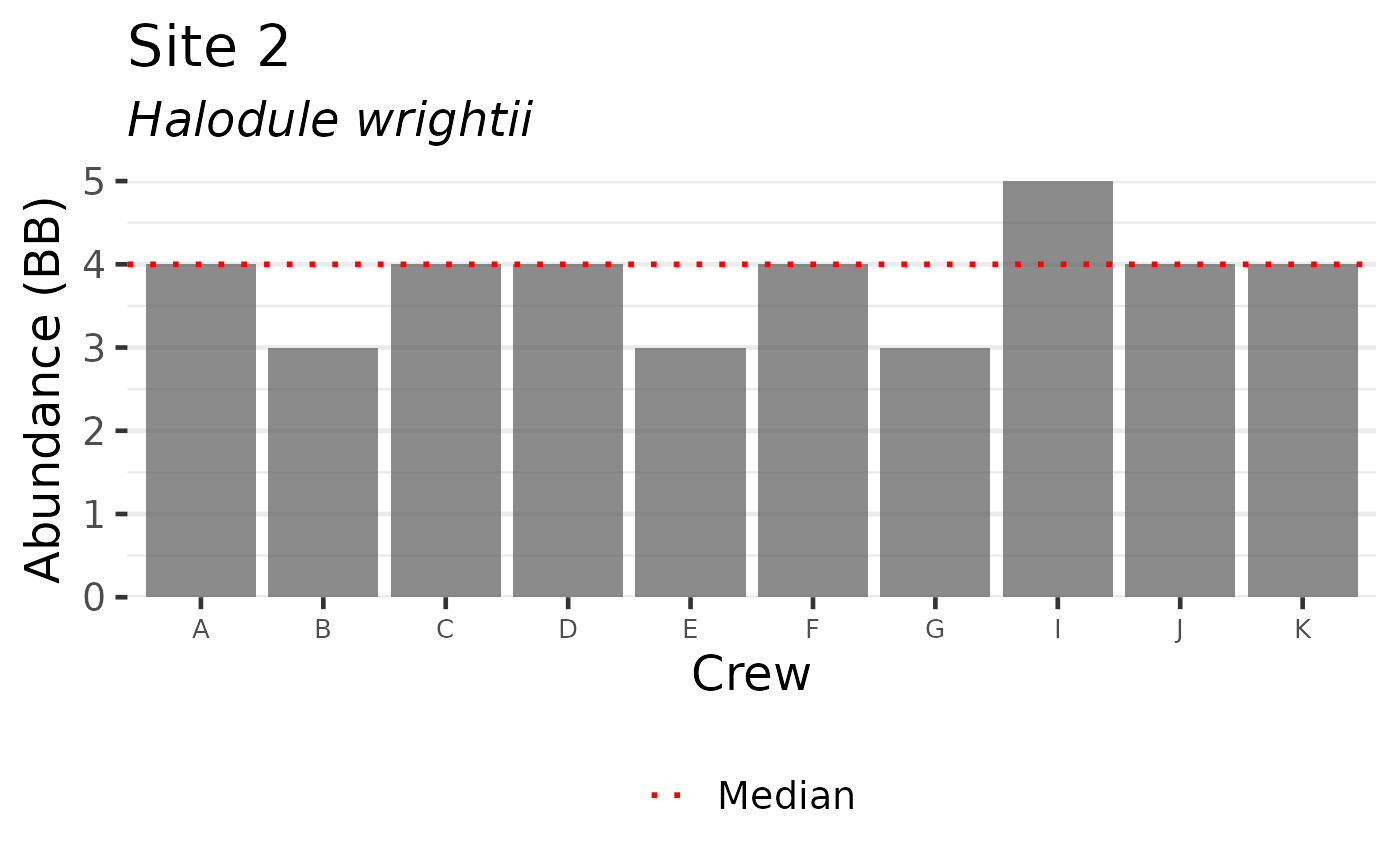
show_compplot(transect, yr = 2025, site = '3', species = 'Halodule', varplo = 'Abundance')
#> Warning: Using `size` aesthetic for lines was deprecated in ggplot2 3.4.0.
#> ℹ Please use `linewidth` instead.
#> ℹ The deprecated feature was likely used in the tbeptools package.
#> Please report the issue at <https://github.com/tbep-tech/tbeptools/issues>.