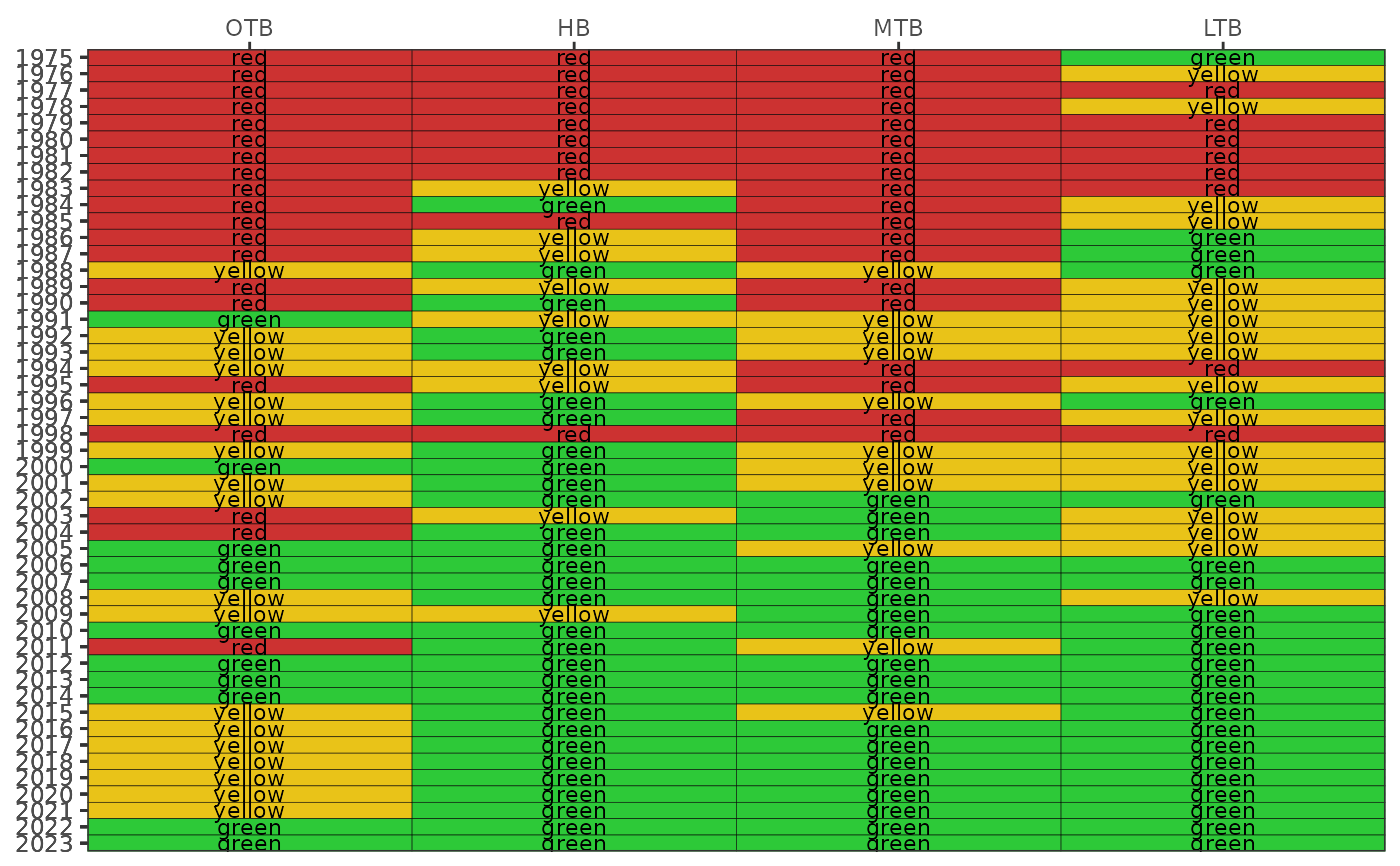
Create a colorized table for indicator reporting
Usage
show_matrix(
  epcdata,
  txtsz = 3,
  trgs = NULL,
  yrrng = NULL,
  bay_segment = c("OTB", "HB", "MTB", "LTB"),
  asreact = FALSE,
  nrows = 10,
  abbrev = FALSE,
  family = "sans",
  historic = TRUE,
  plotly = FALSE,
  partialyr = FALSE,
  width = NULL,
  height = NULL
)
Arguments
- epcdata
data frame of epc data returned by
read_importwq- txtsz
numeric for size of text in the plot, applies only if
tab = FALSE- trgs
optional
data.framefor annual bay segment water quality targets, defaults totargets- yrrng
numeric vector indicating min, max years to include, defaults to range of years in
epcdata- bay_segment
chr string for bay segments to include, one to all of "OTB", "HB", "MTB", "LTB"
- asreact
logical indicating if a
reactableobject is returned- nrows
if
asreact = TRUE, a numeric specifying number of rows in the table- abbrev
logical indicating if text labels in the plot are abbreviated as the first letter
- family
optional chr string indicating font family for text labels
- historic
logical if historic data are used from 2005 and earlier
- plotly
logical if matrix is created using plotly
- partialyr
logical indicating if incomplete annual data for the most recent year are approximated by five year monthly averages for each parameter
- width
numeric for width of the plot in pixels, only applies of
plotly = TRUE- height
numeric for height of the plot in pixels, only applies of
plotly = TRUE
Value
A static ggplot object is returned if asreact = FALSE, otherwise a reactable table is returned