Create a colorized table for water quality outcomes and exceedances by segment
Source:R/show_segmatrix.R
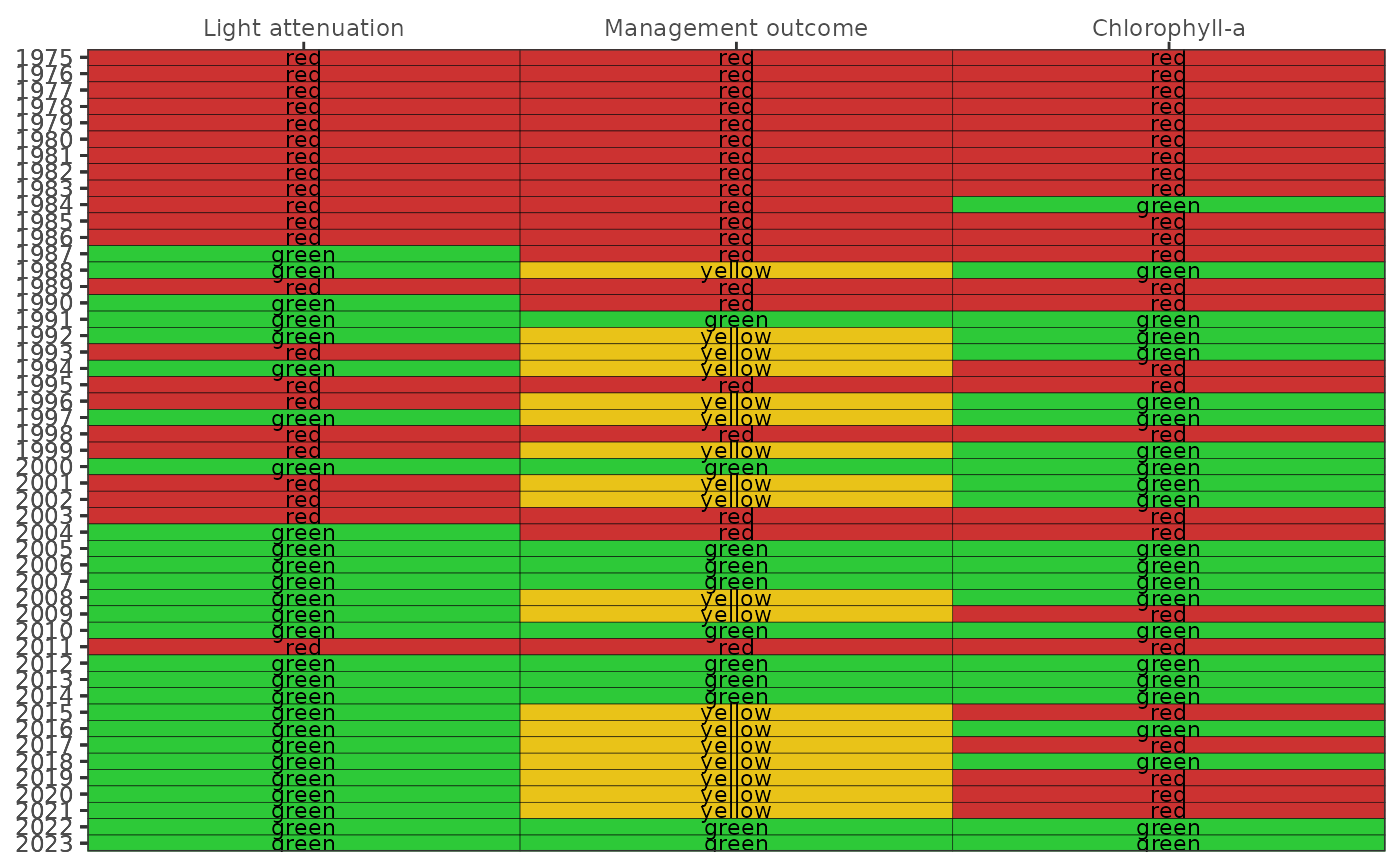
show_segmatrix.RdCreate a colorized table for water quality outcomes by segment that includes the management action and chlorophyll, and light attenuation exceedances
Arguments
- epcdata
data frame of epc data returned by
read_importwq- txtsz
numeric for size of text in the plot, applies only if
tab = FALSE- trgs
optional
data.framefor annual bay segment water quality targets, defaults totargets- yrrng
numeric vector indicating min, max years to include
- bay_segment
chr string for bay segments to include, only one of "OTB", "HB", "MTB", "LTB"
- abbrev
logical indicating if text labels in the plot are abbreviated as the first letter
- family
optional chr string indicating font family for text labels
- historic
logical if historic data are used from 2005 and earlier
- plotly
logical if matrix is created using plotly
- partialyr
logical indicating if incomplete annual data for the most recent year are approximated by five year monthly averages for each parameter
- width
numeric for width of the plot in pixels, only applies of
plotly = TRUE- height
numeric for height of the plot in pixels, only applies of
plotly = TRUE
Value
A static ggplot object is returned
Details
This function provides a combined output for the show_wqmatrix and show_matrix functions. Only one bay segment can be plotted for each function call.