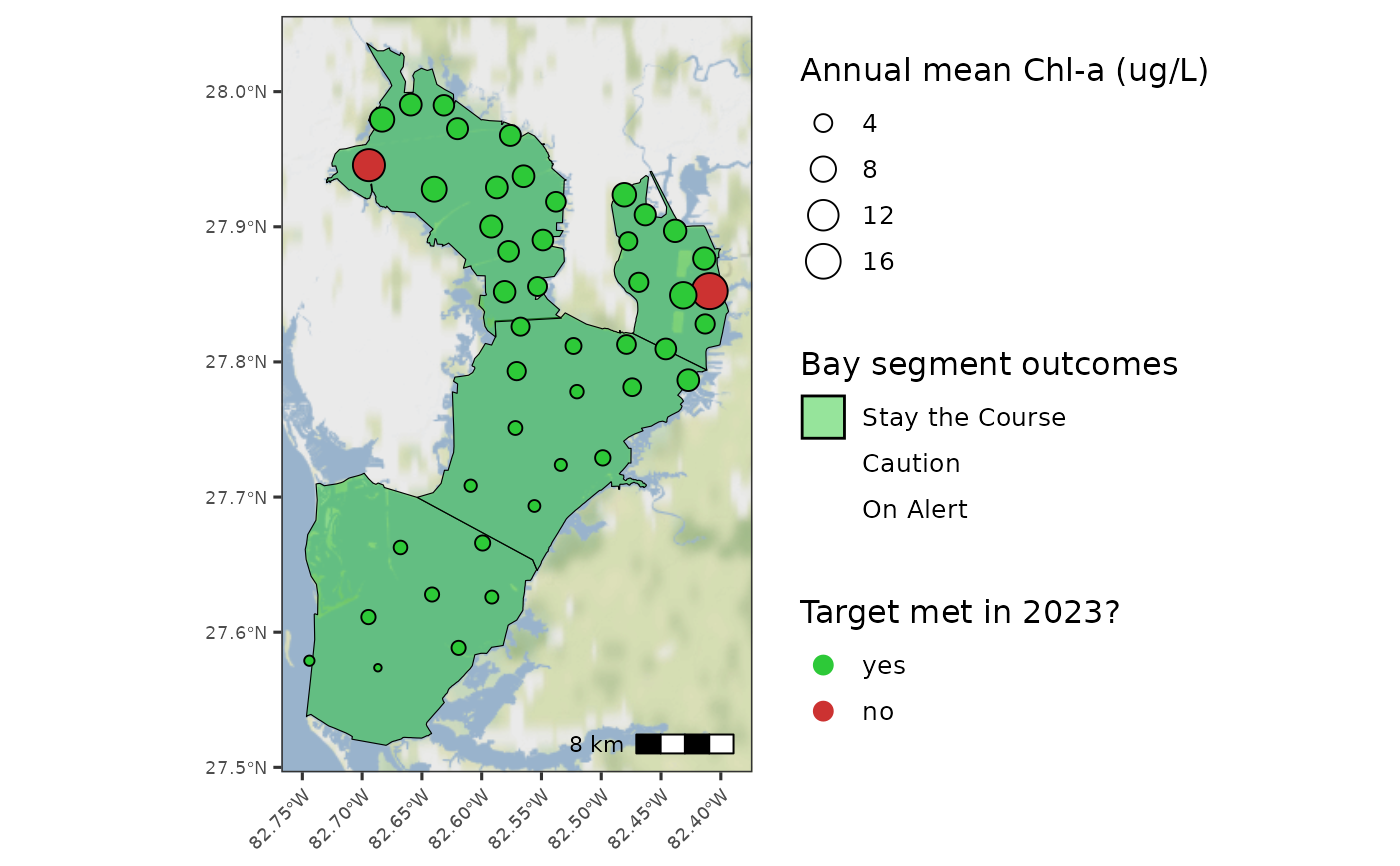
Map site and bay segment attainment categories for a selected year
Source:R/show_sitesegmap.R
show_sitesegmap.RdMap site and bay segment attainment categories for a selected year
Usage
show_sitesegmap(
  epcdata,
  yrsel,
  param = c("chla", "la"),
  trgs = NULL,
  thrs = FALSE,
  partialyr = FALSE,
  showseg = TRUE,
  base_size = 12,
  family = "sans"
)
Arguments
- epcdata
data frame of epc data returned by
read_importwq- yrsel
numeric for year to plot
- param
chr string for which parameter to plot, one of
"chla"for chlorophyll or"la"for light attenuation- trgs
optional
data.framefor annual bay segment water quality targets, defaults totargets- thrs
logical indicating if attainment category is relative to targets (default) or thresholds, passed to
anlz_attainsite- partialyr
logical indicating if incomplete annual data for the most recent year are approximated by five year monthly averages for each parameter
- showseg
logical indicating of bay segment labels are included
- base_size
numeric indicating text scaling size for plot
- family
optional chr string indicating font family for text labels
Details
The map is similar to that returned by show_sitemap with the addition of polygons for each bay segment colored by the annual attainment category and the site points are sized relative to the selected parameter in param.