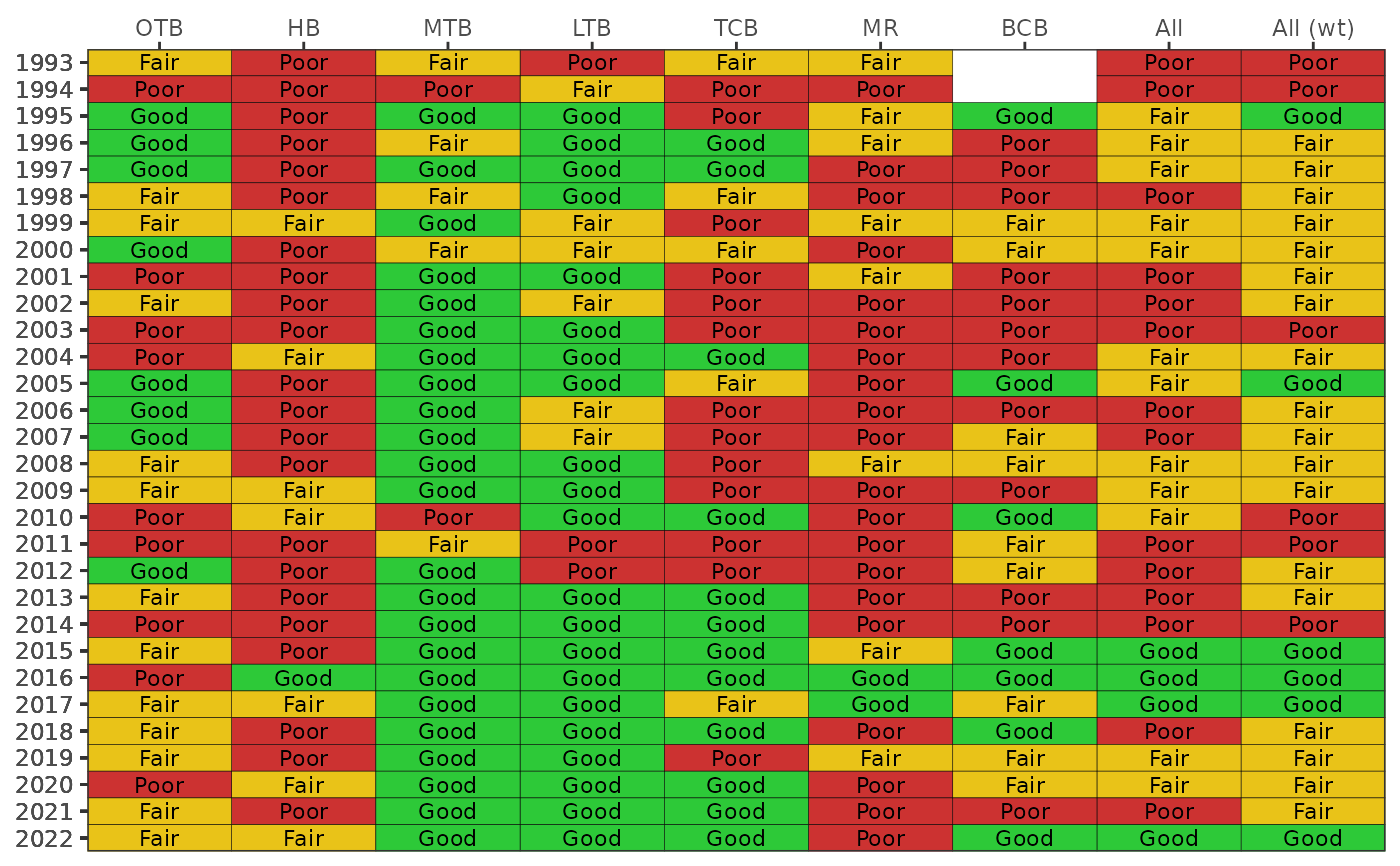
Plot a matrix of Tampa Bay Benthic Index scores over time by bay segment
Source:R/show_tbbimatrix.R
show_tbbimatrix.RdPlot a matrix of Tampa Bay Benthic Index scores over time by bay segment
Arguments
- tbbiscr
input data frame as returned by
anlz_tbbiscr- bay_segment
chr string for the bay segment, one to many of "HB", "OTB", "MTB", "LTB", "TCB", "MR", "BCB", "All", "All (wt)"
- yrrng
numeric indicating year ranges to evaluate
- window
logical indicating whether to use a rolling 5-year window (default TRUE) or single year values (FALSE) for the bay segment categories, see details
- alph
numeric indicating alpha value for score category colors
- txtsz
numeric for size of text in the plot
- family
optional chr string indicating font family for text labels
- rev
logical if factor levels for bay segments are reversed
- position
chr string of location for bay segment labels, default on top, passed to
scale_x_discrete- plotly
logical if matrix is created using plotly
- width
numeric for width of the plot in pixels, only applies of
plotly = TRUE- height
numeric for height of the plot in pixels, only applies of
plotly = TRUE
Value
A ggplot object showing trends over time in TBBI scores for each bay segment if plotly = FALSE, otherwise a plotly object
Details
Additional summaries are provided for the entire bay, as a summary across categories ("All") and a summary weighted across the relative sizes of each bay segment ("All (wt)").
The default behavior is to use a rolling five-year window to calculate the percent of sites in each TBBI category by bay segment. This applies only to years 2005 and later, where the counts from the current year and the prior four years are summed to calculate the percentages. This is intended to help smooth out inter-annual variability due to reduced sampling effort from 2005 to present. If window = FALSE, then only single year values are used.
Examples
tbbiscr <- anlz_tbbiscr(benthicdata)
show_tbbimatrix(tbbiscr)