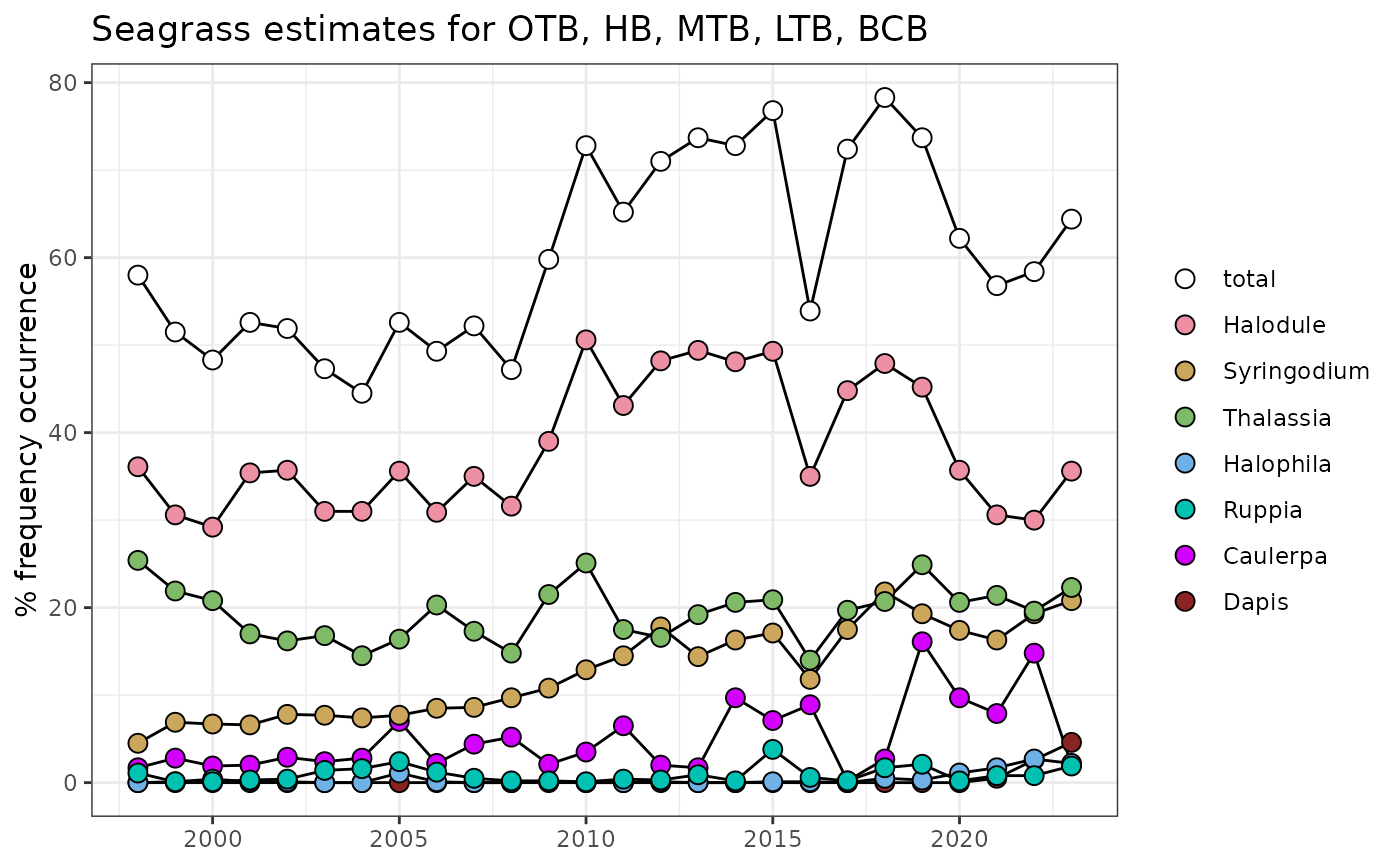
Show annual averages of seagrass frequency occurrence by bay segments, year, and species
Source:R/show_transectavespp.R
show_transectavespp.RdShow annual averages of seagrass frequency occurrence by bay segments, year, and species
Usage
show_transectavespp(
  transectocc,
  bay_segment = c("OTB", "HB", "MTB", "LTB", "BCB"),
  yrrng = c(1998, 2025),
  species = c("Halodule", "Syringodium", "Thalassia", "Halophila", "Ruppia", "Caulerpa",
    "Dapis", "Chaetomorpha"),
  total = TRUE,
  alph = 1,
  family = "sans",
  plotly = FALSE,
  asreact = FALSE,
  width = NULL,
  height = NULL,
  sppcol = NULL
)
Arguments
- transectocc
data frame returned by
anlz_transectocc- bay_segment
chr string for the bay segment, one to many of "OTB", "HB", "MTB", "LTB", "BCB"
- yrrng
numeric indicating year ranges to evaluate
- species
chr string of species to summarize, one to many of "Halodule", "Syringodium", "Thalassia", "Ruppia", "Halophila", "Caulerpa", "Dapis", "Chaetomorpha"
- total
logical indicating if total frequency occurrence for all seagrass species is also returned, only applies if
asreact = FALSE- alph
numeric indicating alpha value for score category colors
- family
optional chr string indicating font family for text labels
- plotly
logical if matrix is created using plotly
- asreact
logical if a reactable table is returned instead of a plot
- width
numeric for width of the plot in pixels, only applies of
plotly = TRUE- height
numeric for height of the plot in pixels, only applies of
plotly = TRUE- sppcol
character vector of alternative colors to use for each species, must have length of six
Value
If asreact = F, a ggplot or plotly (if plotly = T) object is returned showing trends over time by species for selected bay segments. If asreact = T, a reactable table showing results by year, segment, and species is returned.
Details
Results are based on averages across seagrass species (Halodule, Syringodium, Thalassia, Ruppia, Halophila) by date and transect in each bay segment. Drift or attached macroalgae (e.g., Caulerpa, Chaetomorpha) and cyanobacteria (Dapis) estimates may not be accurate prior to 2021. If total = TRUE, a line showing the total frequency occurrence for all seagrass species is also shown (does not include macroalgae or cyanobacteria).
References
The plot is a representation of figure 2 in Johansson, R. (2016) Seagrass Transect Monitoring in Tampa Bay: A Summary of Findings from 1997 through 2015, Technical report #08-16, Tampa Bay Estuary Program, St. Petersburg, Florida.
The table is a representation of table 2, p. 163 in Yarbro, L. A., and P. R. Carlson, Jr., eds. 2016. Seagrass Integrated Mapping and Monitoring Program: Mapping and Monitoring Report No. 2. Fish and Wildlife Research Institute Technical Report TR-17 version 2. vi + 281 p.
Examples
if (FALSE) { # \dontrun{
transect <- read_transect()
} # }
transectocc <- anlz_transectocc(transect)
show_transectavespp(transectocc)