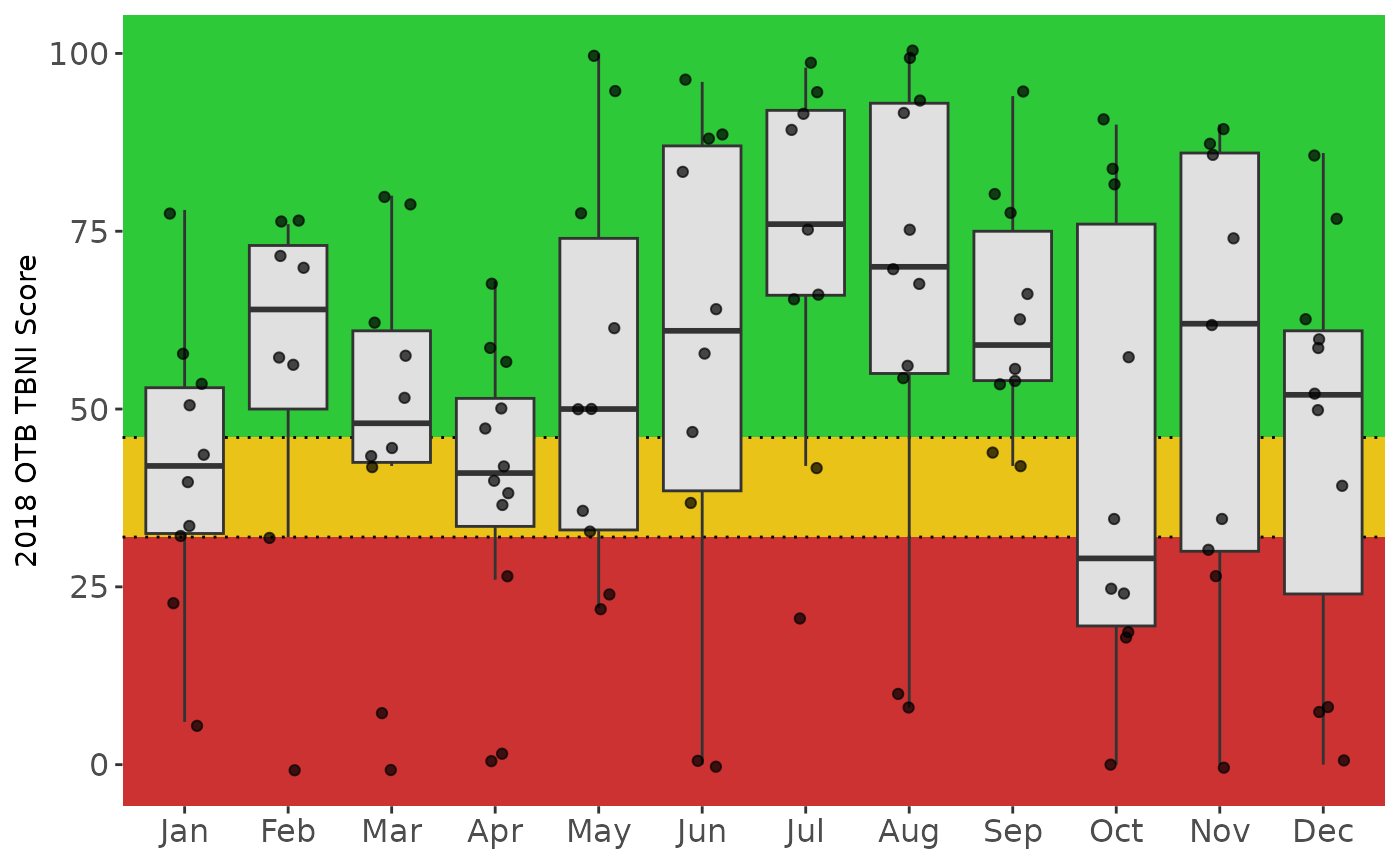
Plot seasonal Tampa Bay Nekton Index results by month and bay segment
Source:R/show_tbniscrseas.R
show_tbniscrseas.RdPlot seasonal Tampa Bay Nekton Index results by month and bay segment
Arguments
- tbniscr
input dat frame as returned by
anlz_tbniscr- bay_segment
chr string for the bay segment to plot, one of "OTB", "HB", "MTB", "LTB"
- yr
numeric for the year to plot
- metric
chr string for the column in
tbniscrto plot on the y-axis, defaults toNULLto plot"TBNI_Score", otherwise an individual TBNI metric can be specified, one of "TBNI_Score", "NumTaxa", "BenthicTaxa", "TaxaSelect", "NumGuilds", or "Shannon"- perc
numeric values indicating break points for score categories, only used if
metricisNULLor"TBNI_Score"- alph
numeric indicating alpha value for the score category background colors and the boxplot fill, only used if
metricisNULLor"TBNI_Score"- plotly
logical if matrix is created using plotly
- family
optional chr string indicating font family for text labels
- width
numeric for width of the plot in pixels, only applies of
plotly = TRUE- height
numeric for height of the plot in pixels, only applies of
plotly = TRUE
Value
A ggplot object showing monthly results for yr in bay_segment for the selected metric, or a plotly object if plotly = TRUE
Details
Boxplots show the distribution of site-level results by month for yr in bay_segment, with individual site values overlaid as jittered points. If metric is NULL or "TBNI_Score", the TBNI score is plotted with the same red/yellow/green score category background and break lines from perc as in show_tbniscr. If a different metric is specified, it is plotted as raw values with no background (note that scored metrics cannot be shown). Metric options include "TBNI_Score" or NULL (default), "NumTaxa", "BenthicTaxa", "TaxaSelect", "NumGuilds", and "Shannon". The y-axis title includes yr, bay_segment, and the plotted metric.
Examples
tbniscr <- anlz_tbniscr(fimdata)
show_tbniscrseas(tbniscr, bay_segment = 'OTB', yr = 2018)